Good Defense in a Bear Market

The S&P 500 slumped 19% in 2022, registering its biggest decline since 2008. Besides geopolitical turbulence and supply-chain disruptions, the market pullbacks were mostly driven by fears of a looming economic slowdown as an undesirable side-effect of the Federal Reserve’s fight against high inflation with aggressive interest rate hikes.

Since there is still a long way to go before inflation can be reined in to around the desired 2% mark, the central bank, by its own admission, is far from done with interest rate hikes. Hence, the market, subdued by the ever-increasing risk of a recession, is unlikely to stabilize anytime soon.

In fact, bearish sentiments have become so pervasive that the strengthening dollar has also been unable to offset the increasing luster of precious metals, such as gold. Such commodities are gaining popularity among market players as ballast during panic-driven market sell-offs and a time-tested hedge against a potential economic downturn.

Which factor will influence gold prices in 2023 the most?

View Results

Loading ... Loading ...

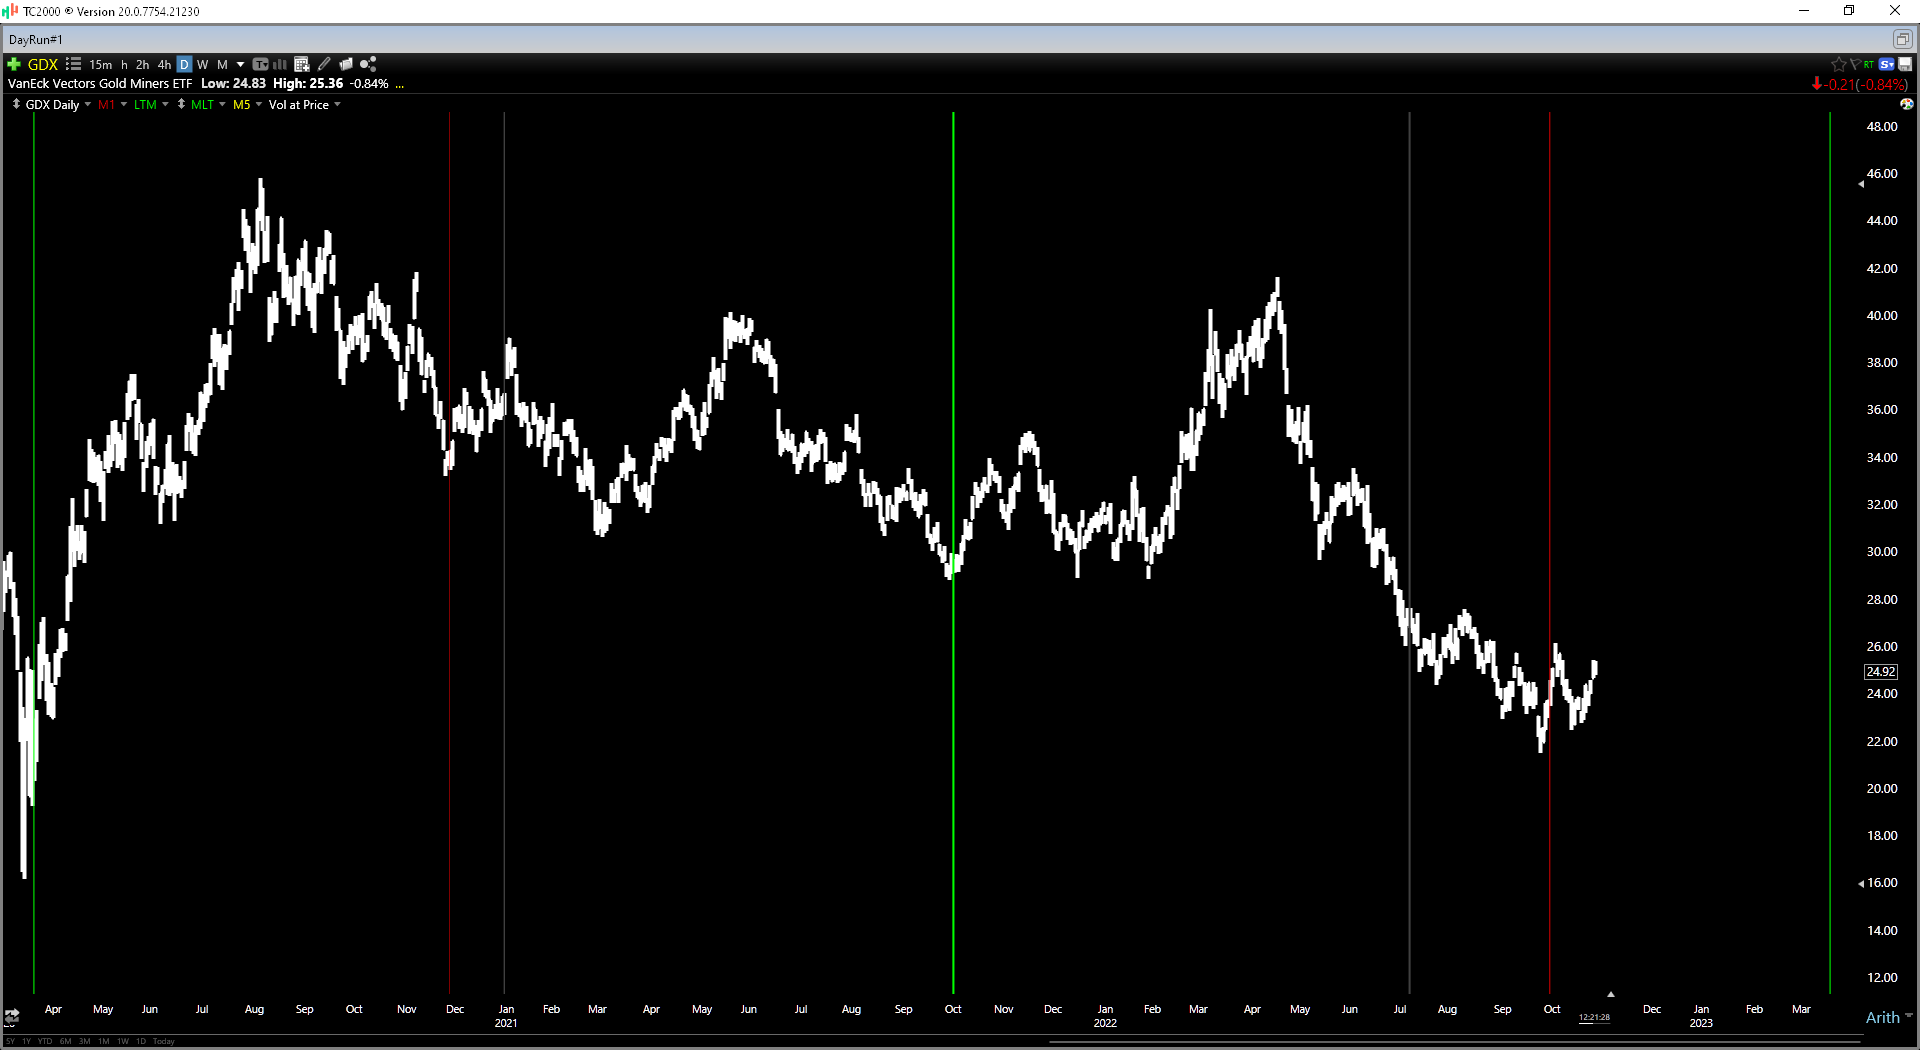
The VanEck Vectors Gold Miners ETF (GDX) is expected to offer downside protection. The fund is managed by Van Eck Associates Corporation. It offers exposure to some of the largest gold mining companies in the world.

Since gold mining stocks strongly correlate with prevailing gold prices, the ETF provides indirect exposure to gold prices.

Here are the factors that could influence GDX’s performance in the near term: Continue reading "Good Defense in a Bear Market"

Not All Gold Miners Are Created Equal

It’s been a challenging two years for investors in the gold space, with the metals making no progress since Q3 2020 and the Gold Miners Index (GDX) suffering a 52% decline from its highs.

This violent bear market can be attributed to significant margin compression for most gold producers, with them being hit by inflationary pressures (fuel, steel, cyanide, labor) and the impact of a lower gold price on sales.

The result? Margins are down over 25% on average from Q3 2020 peak levels.

GDX Chart

(Source: TC2000.com)

On the surface, this might not seem like a very attractive investment thesis given that gold producers are price-takers, gold continues to trend lower, and they’re already seeing margin compression at $1,660/oz.

However, the 52% correction in the GDX has left sector-wide valuations at their lowest levels since 2018, when all-in-sustaining cost margins were at $200/oz, nowhere near the $500/oz margins currently.

Hence, I believe this negativity is more than priced into the sector, especially if gold can find a floor near $1,600/oz, which looks likely given that we have extreme pessimism.

That said, not all miners are created equal, so it’s essential to focus on quality and those names bucking the margin trend. In this update, we’ll look at two names trading at deep discounts to net asset value that have outstanding business models: Continue reading "Not All Gold Miners Are Created Equal"

Five Mining Companies Joe Reagor Believes Are Ahead of the Curve

The Gold Report: What's your gold price forecast for the rest of 2015?

Joe Reagor: For the full year, our average price is $1,260 per ounce ($1,260/oz). If the U.S. dollar were to remain steady and not strengthen, gold could reach $1,300/oz by year-end.

TGR: Gold was sold off heavily in the last week of April based on an anticipated interest rate hike by the Federal Reserve. Should the Fed actually raise the rate, how much of a negative effect will that have on gold and for how long? Continue reading "Five Mining Companies Joe Reagor Believes Are Ahead of the Curve"

Gold Mining is Counter Cyclical

The following is the opening segment of this week’s Notes From the Rabbit Hole, NFTRH 276:

Somewhere along the road from the 2000 bottom in gold stocks to the 2008 flame out of inflationary hysteria, the gold stock sector went from counter cyclical first mover to ‘inflation trade’ also ran.  Gold stocks put in a secular bear market bottom in 2000 just as the US and many global economies were topping out.

Then came the era that NFTRH has labeled ‘Inflation onDemand’ (IoD).  The economy was successfully* inflated by Alan Greenspan early in the decade as easy monetary policy fomented an epic credit bubble, which took over and did the heavy lifting for a cyclical bull market and buoyant economy that terminated hard in 2007/2008.

During this time of IoD ‘inflation bulls’ and commodity bulls who had all the answers for a newly inflation-phobic public emerged and took center stage.  Misperceptions were formed, cemented and driven home.  Nowhere were the misperceptions more intensely and dangerously embedded than the gold stock sector, which at its core is different than most commodity sectors and indeed, most stock sectors.  Introducing another one of our ‘busy’ charts to illustrate…

hui.mo

Okay, article over… the chart says it all.  No more words necessary! Continue reading "Gold Mining is Counter Cyclical"

Crude Oil Breakout & Some Implications

At the moment, crude oil seems to be acting as a free agent instead of in concert with the commodity complex that would play a role in signaling the effects (or lack thereof) of the inflation to date.  The target off this formation, if it holds, is 110 or so.  But as noted in a previous post, a drive toward 110 would load a significantly higher target, which we have been charting in NFTRH over the last several weeks by monthly chart. Continue reading "Crude Oil Breakout & Some Implications"