Gold Update: Hard Top or Glass Ceiling?

Gold price came very close to hitting the double barrier at $2,070-$2,100 of the black path target and the upper boundary of the bullish trend channel outlined earlier this month. The new 1-year top has been established at $2,063.

You were amazingly accurate this time as most of the votes were for the black path to lead the way. The market has since reversed to the downside, raising the question of whether it was a hard top or a glass ceiling.

To answer this question, let me show you an updated chart below.
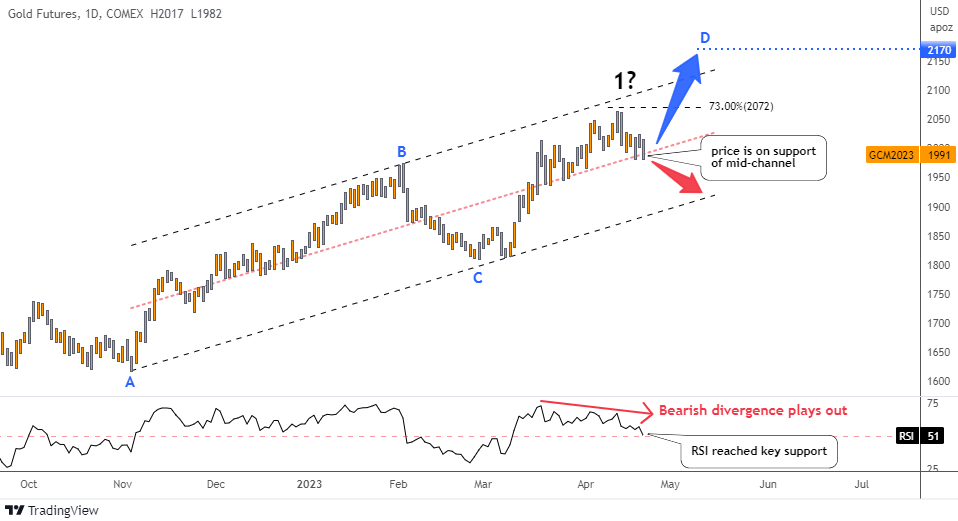
Gold Futures Daily

Source: TradingView

The price has slid down to the pink mid-channel support within the black bullish trend channel.

In the RSI sub-chart, we can clearly spot a bearish divergence as the falling peaks didn't confirm the new top in the price chart. This has been playing out, pushing the price down. The indicator's reading has reached the key support of 50, just like the price. Continue reading "Gold Update: Hard Top or Glass Ceiling?"

Gold Update: Is Half Enough?

Since my last major update in November, the gold futures price has increased by almost 12%. At that time, most readers had chosen the bullish target of $2,089, where the price would retest the all-time high.

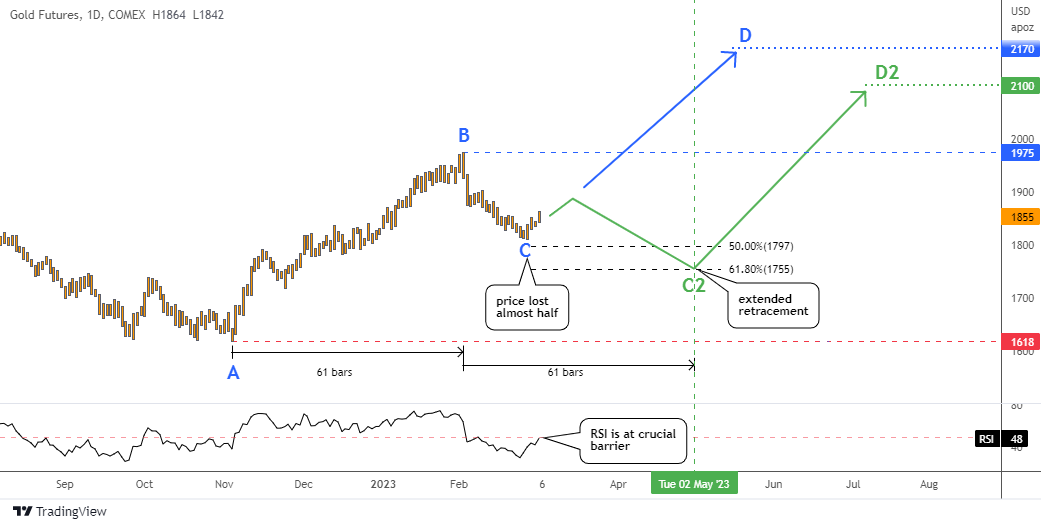
The gold futures chart is due for an update as it has reached a significant point in the current retracement following its recent peak at $1,975.

Gold Futures Daily

Source: TradingView

The gold futures price had been steadily rising for three months from the start of November until the beginning of February, where it reached a top of $1,975.

However, the market was hit when the “Jobs Report Dropped A Bombshell On The Markets”, which caused a significant drop in the value of many assets, including gold.

The recent price action in gold futures has been notable, marked by a sudden drop of $100 at the beginning followed by a slower decline in pace as the price retraced almost 50% and hit $1,811 by the end of February.

The question is whether this loss of half of the preceding rally is enough to consider the current bounce as a reversal. Continue reading "Gold Update: Is Half Enough?"

Can Central Banks See What We Don't?

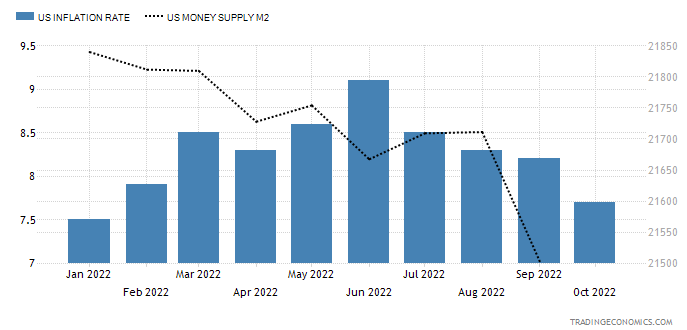
The gold futures have skyrocketed on better than expected U.S. inflation data last week. The annual inflation rate in the U.S. slowed for a fourth month to 7.7% in October, the lowest reading since the start of a year, and well below forecasts of 8%.

US Annual Inflation & M2

Source: TRADING ECONOMICS

According to logic, the gold price should fall as anti-inflationary tightening measures have shown positive results in cooling price growth. The printing press, represented by the M2 money supply indicator (black dotted) in the chart above, has stopped and the reading is declining as well.

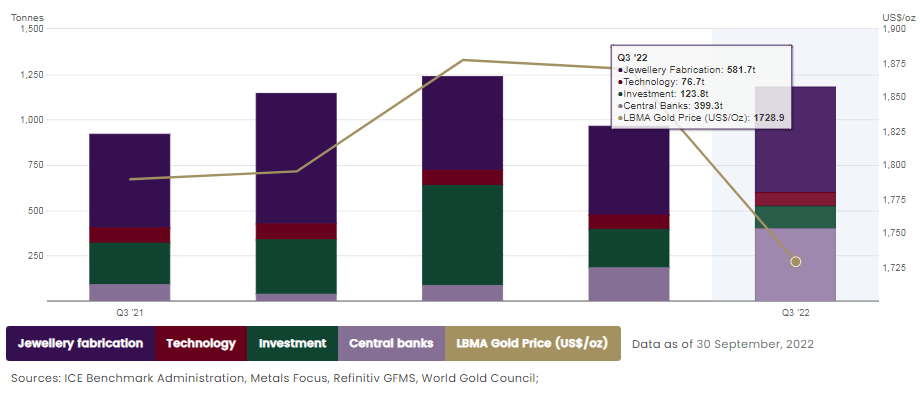
Let us check the chart below to look for an answer in the fundamental data of world gold demand.

WGC Gold Demand

Courtesy of World Gold Council

The graph above shows the quarterly data of demand statistics in the period from Q3 2021 to Q3 2022. According to the data, the most stable demand source comes from a technology side (wine-colored). The jewelry demand (dark purple) is price sensitive: it shrinks on the rising price and expands during price falls. The investment demand (dark green) is cooling down amid the tightening as per the logic I explained above. Continue reading "Can Central Banks See What We Don't?"