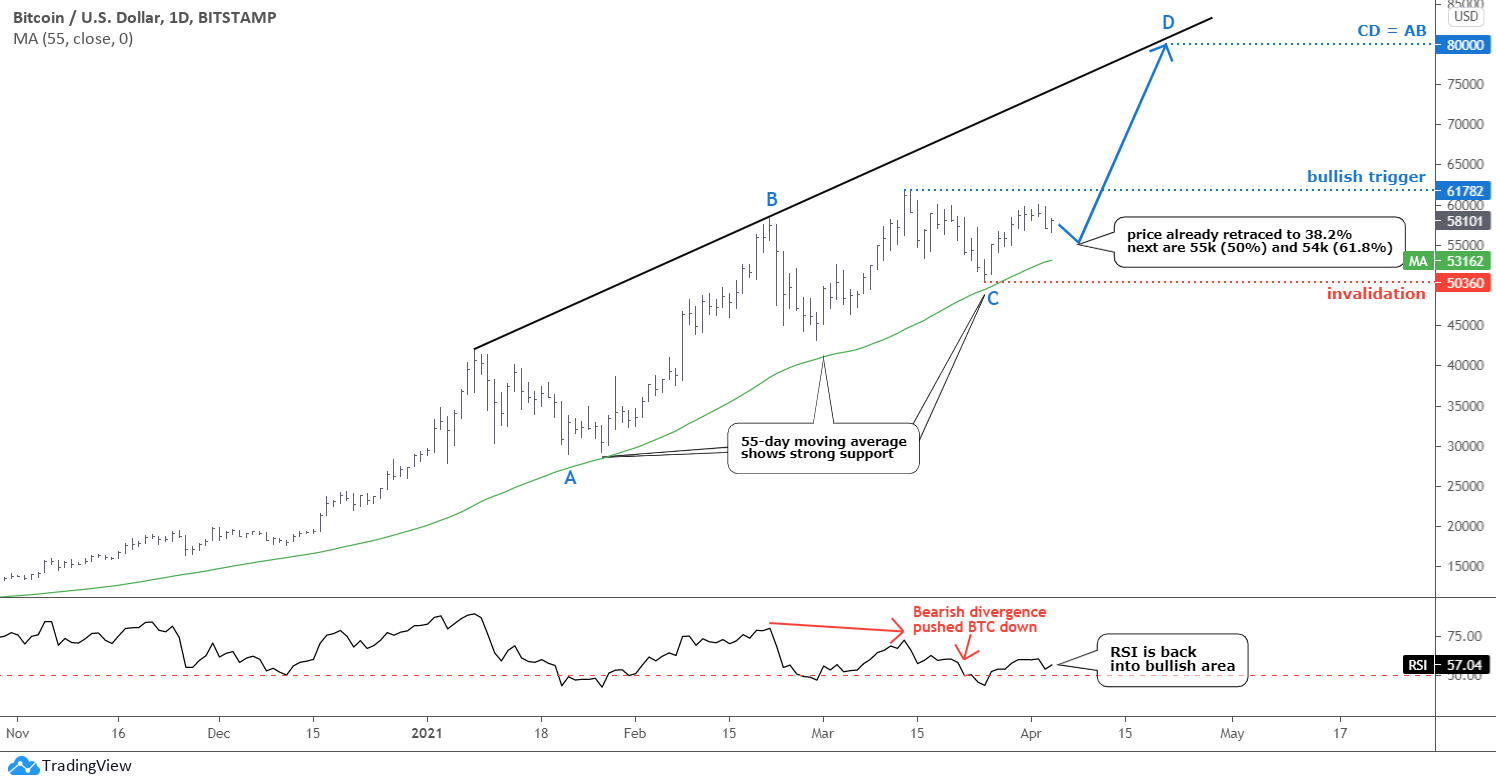
As Bitcoin matures, the chart structure becomes more readable over time. We can see how such a conventional indicator as a moving average perfectly supports the price. I added a 55-day (Fibonacci number) moving average (green), which at least three times this year kept the price in the bullish mode that started last October when the price crossed this line to the upside.
Another popular indicator RSI has perfectly detected the Bearish Divergence and pushed the price down last month. After that, it moved back above the crucial 50 level, which supported the current upward move.
I see possible AB/CD segments in the chart (blue labels). The BC consolidation was huge and complicated, but it could be over now. If the CD segment travels the same distance as the AB part, then the price of Bitcoin could hit the new all-time high of $80,000. The projection of the black trendline resistance confirms that ambitious target, and we know how powerful the trends are. Continue reading "Bitcoin, Dollar, Gold And Silver Update"


