Gold & Silver: The King Fights Back

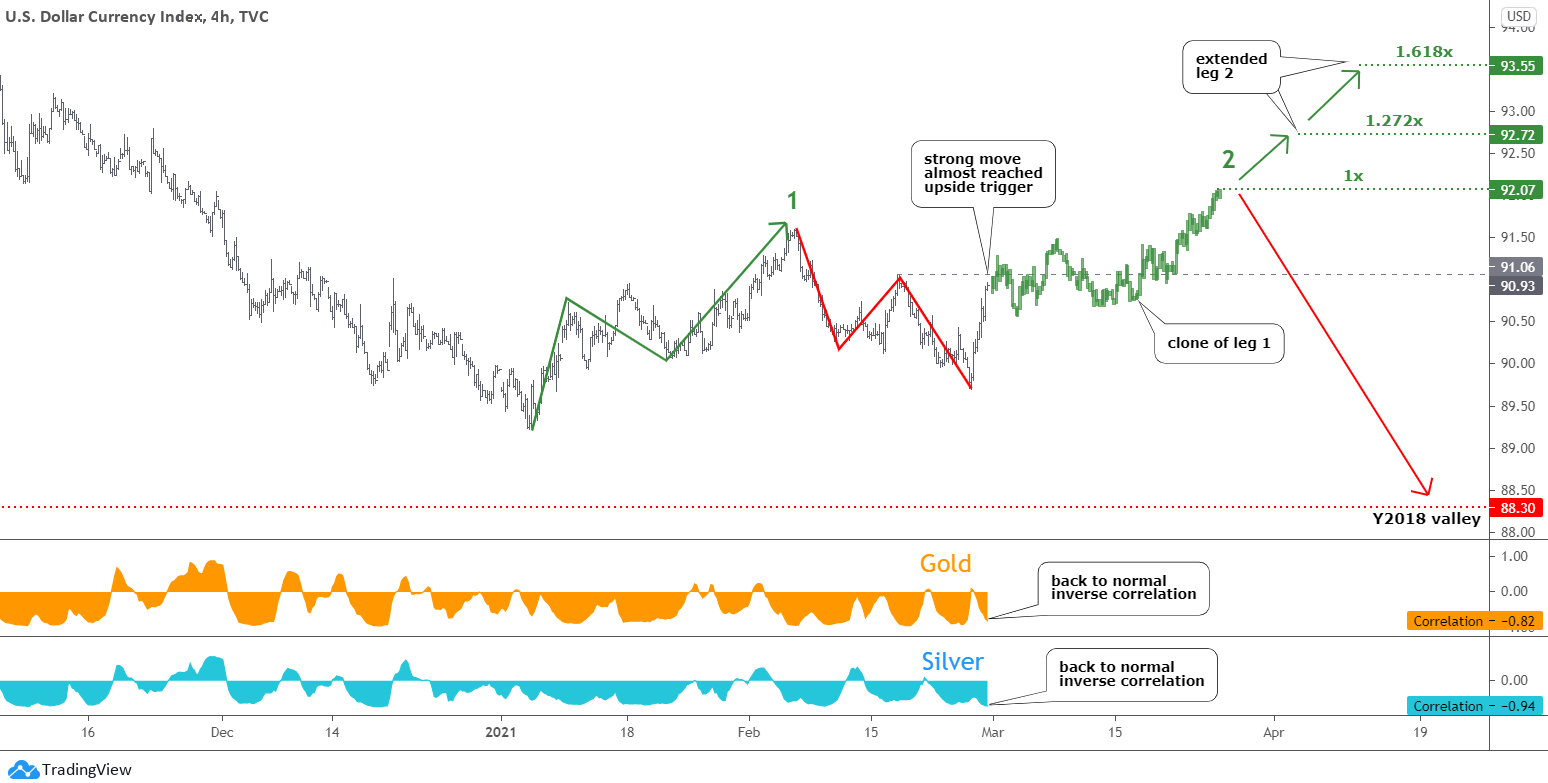
The benchmark 10-year Treasury yield spiked to 1.61% last week for the first time in more than a year. The U.S. dollar, aka “King,” fought back to the upside on this growth of the yield. Investors ran out of other assets, including precious metals, and its price dropped.

Let us see the updated structure of the U.S. dollar index (DXY) in the chart below.

dollar

It looks like the DXY moves according to your favorite orange path to the upside that was published last week. However, the sharp drop below the earlier valley eliminated both scenarios. Continue reading "Gold & Silver: The King Fights Back"

Watch Gold, Leave Silver Alone

It is time to update the charts as gold triggered the former valley of $1765 last Friday.

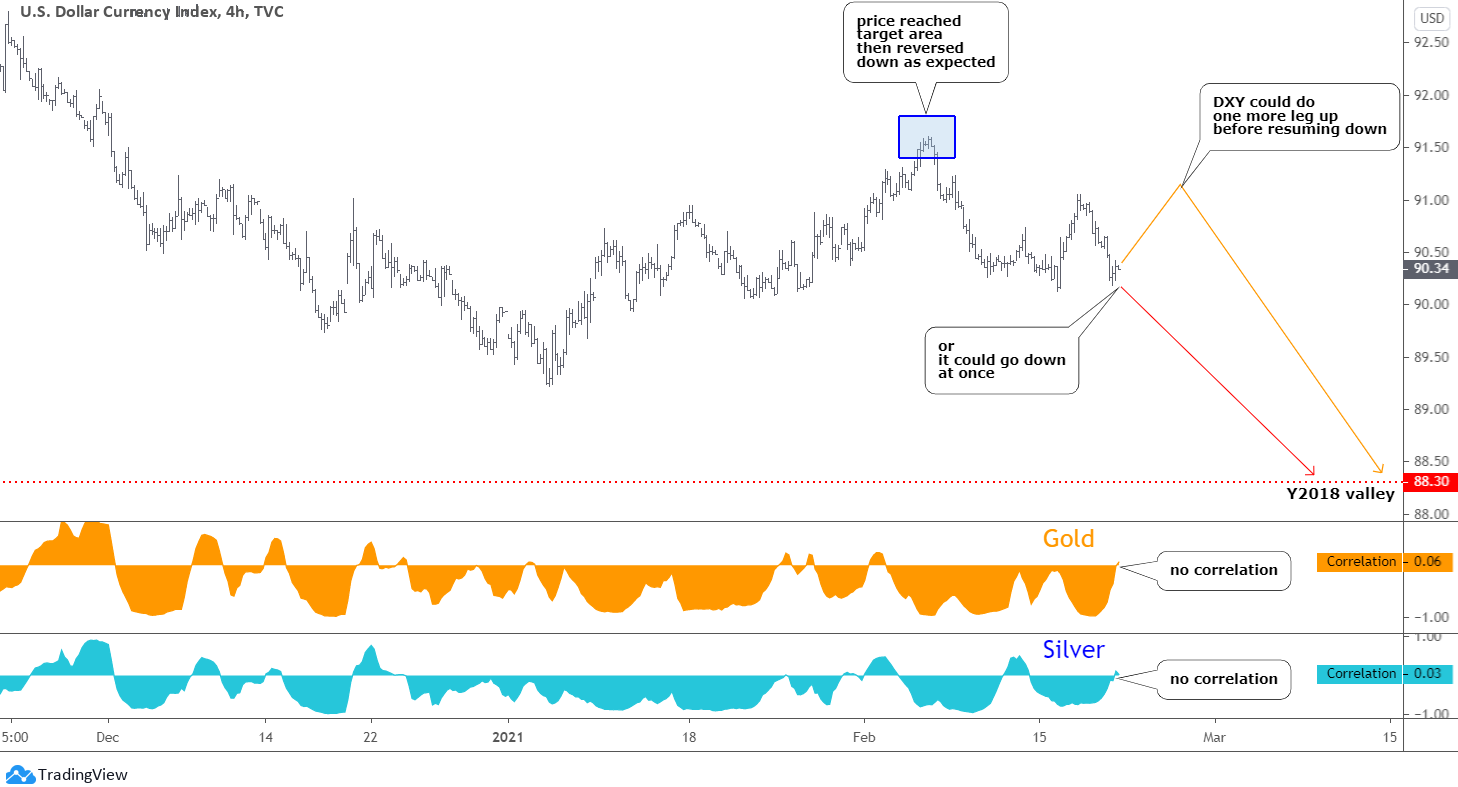
The U.S. dollar index (DXY) opens this post.

Dollar Index

Most of you agreed last month with the plan that the dollar index will extend its consolidation to the upside, making a zigzag first to the downside and then to the upside with the target area between 91.40 and 91.80 (blue box). The former was your favorite goal, and it was hit with a margin as the price reached 91.60 at the top of this month. Continue reading "Watch Gold, Leave Silver Alone"

Gold Could Be Setting Up For A Breakout

There has been quite a bit of chatter related to precious metals lately. The rally in Cryptos, particularly Bitcoin, and various other stocks have raised expectations that Gold and Silver have been overlooked as a true hedging instrument. As these rallies continue in various other stocks and sectors, Gold and Silver have continued to trade sideways over the past 6+ months – when and how will it end?

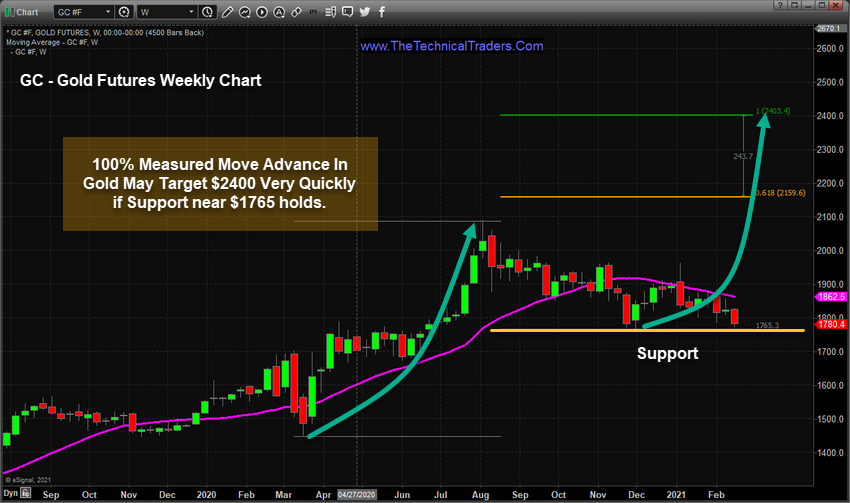
Gold Support Near $1765 May Become A New Launchpad

My research team and I believe the recent downside trend in Gold has reached a support level, near $1765, that will act as a launching pad for a potentially big upside price trend. This support level aligns with previous price highs (May 2020 through June 2020) after the Covid-19 price collapse, which we believe is an indication of a strong support level. As you can see from the Gold Futures Weekly chart below, if Gold price levels hold above $1765 then we feel the next upside rally in metals could prompt a move targeting $2160, then $2400.

Gold

The February 2021 Gold contract expires on February 24 – only a few days away. The CME Delivery Report shows an incredible amount of contracts already giving notice of a “Delivery Request”. This suggests that on or near February 25, a supply squeeze for Gold and Silver may become a very real component of price. Continue reading "Gold Could Be Setting Up For A Breakout"

Gold & Gold Stock Corrections Are Normal

Corrections in Gold and Gold Stocks are completely normal in an inflationary macro market phase.

Every week I notice the agony ratcheting up incrementally. While the rest of the casino takes off to the speculative heavens, gold sits on its heavy ass and the gold miners go nowhere in a downward-biased perma-correction. Or so it seems. It’s all normal and I’ll explain why.

First of all, it is not healthy to be railing against unseen nefarious manipulative interests. That is emotion and emotion has to be kept out of it (and yes, I get as aggravated as the next guy sometimes, but it cannot affect your plan or you will be the victim, the mark). You have to take what the market gives you and roll with it. All markets are manipulated when you consider that the greatest manipulation of all is courtesy of the Federal Reserve, implementing it's MMT (Modern Monetary Theory), err, that is TMM (Total Market Manipulation) toward desired ends.

The primary tool in that manipulation is inflation. The oldest trick in the Fed’s book. But they can only inflate under cover of a deflationary macro and the 2020 COVID-crash made that the story and as yet it’s a condition that keeps on giving license to the inflators. But very likely sometime in 2021, our indicators will signal a failure into another deflationary liquidation or a more intense inflationary problem, neither of which would be positive for the economy. Continue reading "Gold & Gold Stock Corrections Are Normal"

S&P 500, Dollar Index, Gold, And Silver Updates

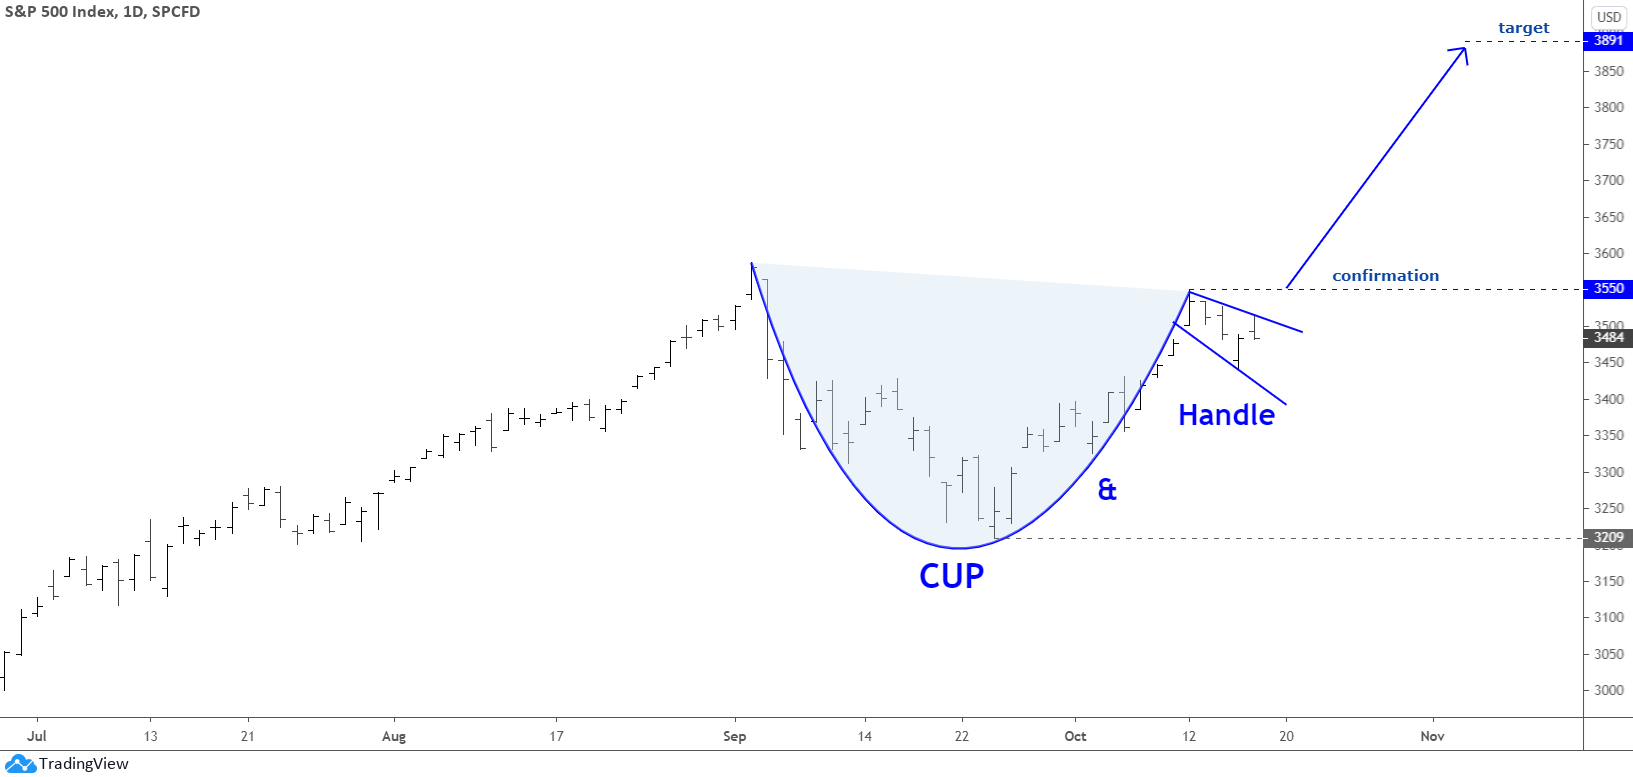
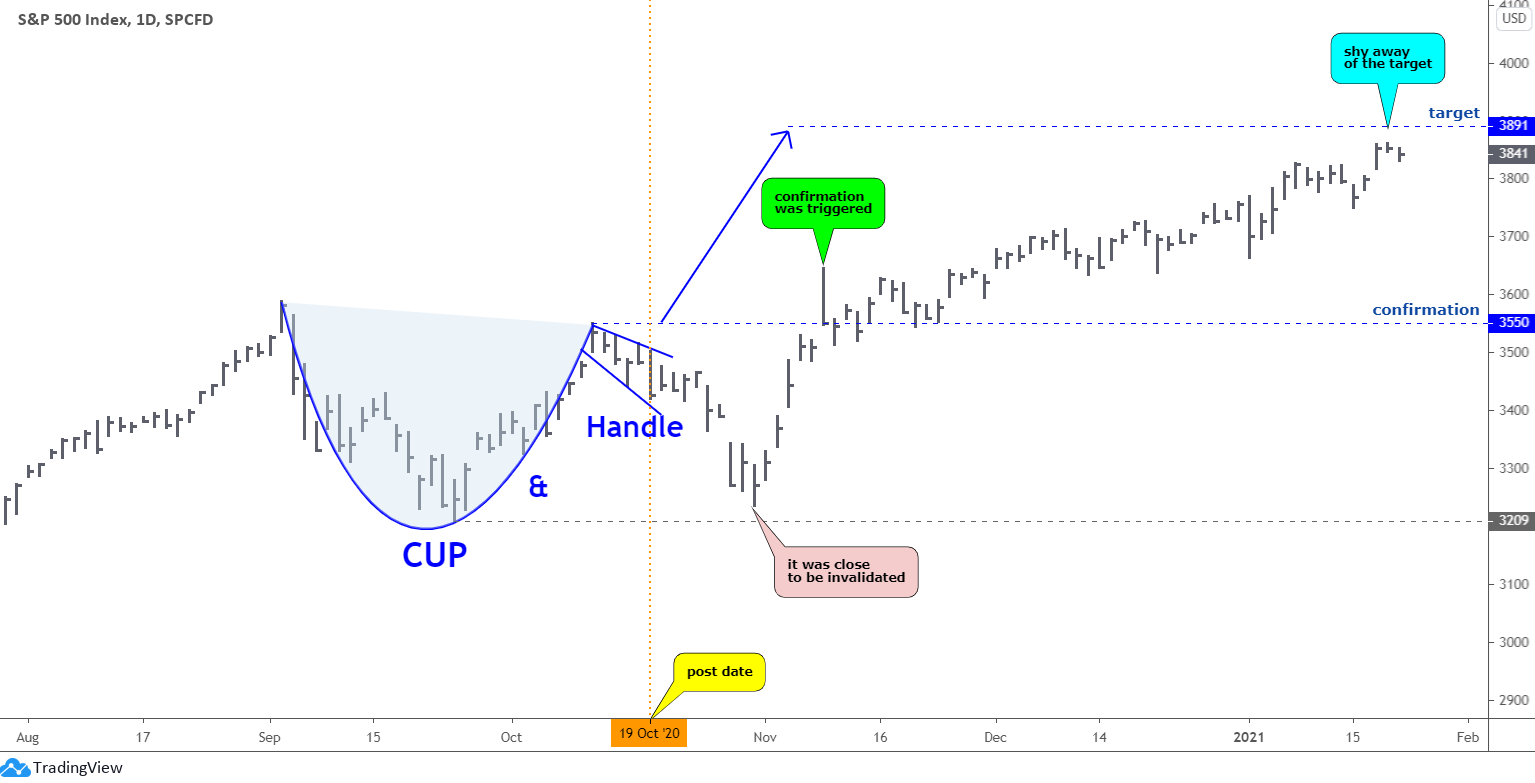
Before I start this update about the dollar, gold and silver, I would like to show you how accurate your prediction was for the S&P 500 back in October of 2020! At the time, I demonstrated to you the well-known Cup & Handle pattern in the making. That model was promising as the target was set at an ambitious $3891 level. Let us see it again below to refresh the memory.

S&P 500, Dollar Index, Gold, And Silver Updates

When I asked your opinion, whether this pattern is valid and will play out, most of you replied positively and supported my target. Let us see in the updated chart below how it played out.

S&P 500, Dollar Index, Gold, And Silver Updates

Your "crystal ball" worked perfectly as the new record maximum established last Thursday at $3860 had been just $31 below the target. The price action was not straight to the target as after the post, the price dropped quite deep, and the whole model was close to invalidation. Luckily, the further reversal built the "no look back" upside move. Continue reading "S&P 500, Dollar Index, Gold, And Silver Updates"