Gold Hit First Target

Last Wednesday gold had hit the minimum target of $1490 that we were waiting for since January when the price was at $1288. The target was clear, but the path was not and only this May the market eliminated one of three possible options. One month later, it has finally shown its real face leaving the single initial path to go.

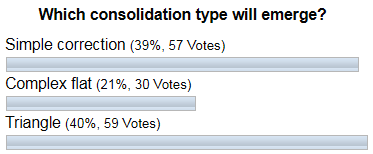
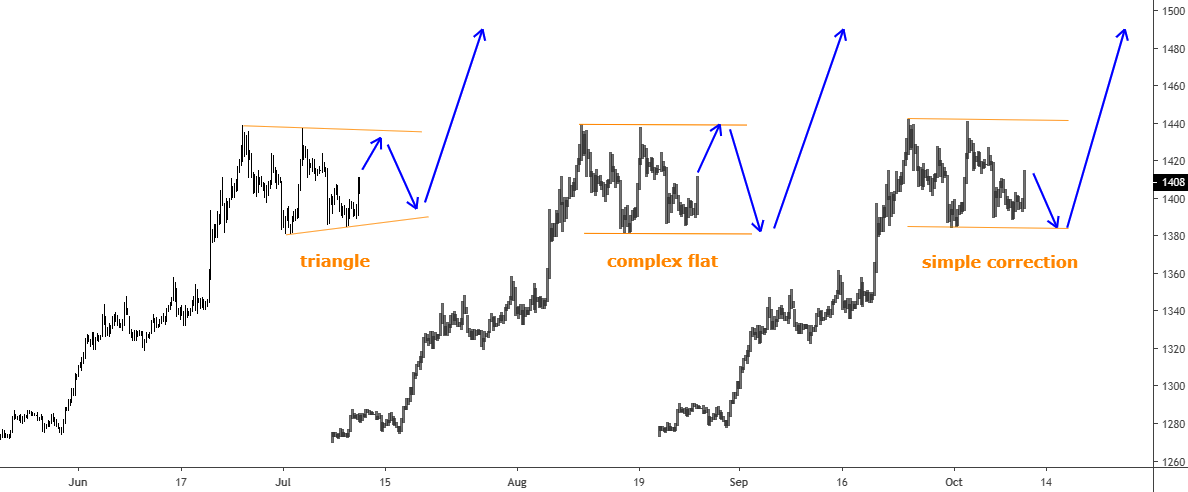
Last month gold advanced quite well, but it failed ahead of the first target. I spotted the consolidation on the 4-hour chart and shared it with you to reassure disappointed bullish traders as to when the price doesn’t reach the target someone could start to exit early. Consolidations are tricky by nature, and I showed you three possible types it could unfold. Let’s see below which one you liked the most.

Gold Poll

The triangular type was your first choice; the simple correction was the second with a minor gap, and the complex flat was the least liked. And again the majority of you were right as this was a triangle. Let’s see it in the updated 4-hourly chart below. Continue reading "Gold Hit First Target"

The Bond Yield Continuum And Gold

Have you heard the news? US Treasury bonds are skyrocketing as it turns out there is no inflation amid a global central bank NIRP-a-thon and race to the currency bottom. Going the other way, our 30yr Treasury yield Continuum is burrowing southward.

If you check out yesterday’s post you’ll see proof that the 2018 NFTRH view that people should tune out the bond experts instructing BOND BEAR MARKET!! was 100% on target.

But today the din is coming from the opposite pole. Everywhere you look on the financial websites it’s now about tanking yields, decelerating growth, trade war damage, and deflation. Here is the 30-year bond yield (TYX), which is front and center in this hysteria (click the charts below for the clearest view). That is one impulsive looking drop.

30 year bond yield

But just as we warned that the precious metals move was a “launch” (not a blow-off as some were calling it) in June because it was at the beginning rather than the end of an extended move, we note that TYX is impulsively dropping into a potential climax. Everybody is on the opposite side of the boat they were on in H2 2018. That would be the BOND BEAR MARKET!! side of the boat with experts Gross, Gundlach, and company. Now amidst the current Armageddon (the SPX is after all down a whole 4% from its all-time high, he said sarcastically) backdrop, it’s all BOND BULL MARKET!! all the time.

Wash…

Rinse…

Repeat… Continue reading "The Bond Yield Continuum And Gold"

Precious Metals Big Picture

While many are talking about major new bull markets in gold, silver and the miners I find it safer to set realistic goals within a still very bullish outlook. After all, we became bullish in November, had to retrench due to over-bullish sentiment and fading fundamentals in February (both situations linked here) and then have been back in the bull seat since the gold stock launch as noted on June 3rd.

The point being, I have nothing to prove to you; nothing to woo you and tempt your greed impulse about. NFTRH has simply called the sector in line with its fundamentals and technicals, and that is what we continue to do as of this day. We chart 20 quality miners (+/-) each week and note short-term targets, resistance, etc. for the miners, gold and silver routinely.

The other priority is to stay on top of the still-bullish fundamentals. Most recently silver joined the party and is probably slamming our favored theme into gear, which is for it to take over leadership from gold and potentially lead the macro to a future inflationary cycle. Easy now, that is still in the realm of potential, not yet reality. But all of this fun – and it has obviously been fun lately – takes place against a big picture that is lumbering along at its own pace.

What I like best is that due to the big picture view I can put forth a conservative 2019 plan, and it still calls for a minimum of another 70% upside for the HUI index. Within that, many of the miners we track will do much better. And within that, we have not even seen the speculative end wake up yet. Those would be the little TSX-V type penny stock bottle rockets (lottery tickets) that pull 400% rallies out of nowhere when they finally get played.

Okay, let’s reel it into the lumbering big pictures on HUI, gold, and silver. As noted, there will be bumps and pullbacks along the way. Monthly charts are not preferred for managing those situations so we’ll stick with the dailies and weeklies in NFTRH reports. But with the ferocity of the current rally (and the fundamentals behind it) it appears a good bet that a second leg to the impulsive ‘A’ leg in 2016 is underway after the beautiful consolidation that killed everyone’s spirits (as it should) since 2016. Continue reading "Precious Metals Big Picture"

Gold Update: Pitfall Or Pit Stop?

The mighty metal has almost hit the Bull Flag’s target, which was set two months ago. Gold was got close as it reached $1439 on June 25th and only had $6 left to reach that level. Usually, when the impulse of the price gets exhausted without breaking the important level or after it briefly penetrates the latter, then the price quickly retraces in the opposite direction. And that’s what we got with the gold price as the impulse initially looked strong enough to catapult the metal to the $1500 area, but suddenly it failed. Therefore, the price dropped back below $1400 to $1382. Then the buyers actively bought this drop up again to the former top, but they stopped just $1 below it and capitulated there as the price plummeted to $1386 back below $1400. These seesaw moves make traders nervous as it is dangerously volatile with more than $50 setbacks.

The question is if it is a pitfall and we shouldn’t expect any further strength of gold, or it’s just a pit stop to make a pause to accumulate a momentum for another push higher? Let’s look into the chart below to try to figure it out.

I dipped into the 4-hour time frame to show you what happens there.

Gold
Chart courtesy of tradingview.com

First of all, I would like to point out that I believe that we are just in a correction before another push higher, so I choose the pit stop option for the gold. Therefore, my chart will be based on this idea. Continue reading "Gold Update: Pitfall Or Pit Stop?"

Gold Stock Launch In The Books; What's Next

You may know me as the…

gold

…guy.

The guy using the planets of an imaginary gold sector Macrocosm with proper fundamentals that are decidedly not imaginary but rather, are necessary to call a real bull phase or even bull market. By managing a strict set of macro and sector fundamental inputs (to the sound of crickets and little else in the sector) NFTRH and its subscribers had a front row seat to the now obvious gold mining launch as first the fundamentals came in line, followed by the technicals.

The reason this needs to be highlighted is because there is a popular Elliott Wave analyst out there * (among a few others) talking about how it’s all in the wave counts (unless they are revised, as often happens with EW) or other technicals, and fundamentals don’t matter. As if the answer is all technical and sentiment based. Well, those two things are important, but please. As happened in dramatic fashion when we became super bullish in Q4 2008, the fundamentals kicked in first and gave a green light to taking technical signals more seriously along the way. Look, I am a TA too, but The Men Who Stare at Charts exclusively are pitching only half the story. Continue reading "Gold Stock Launch In The Books; What's Next"