Gold & Silver: Beware Of Extended Consolidation

Gold and silver chart structures got synchronized, and I am happy to bring them back together in this post.

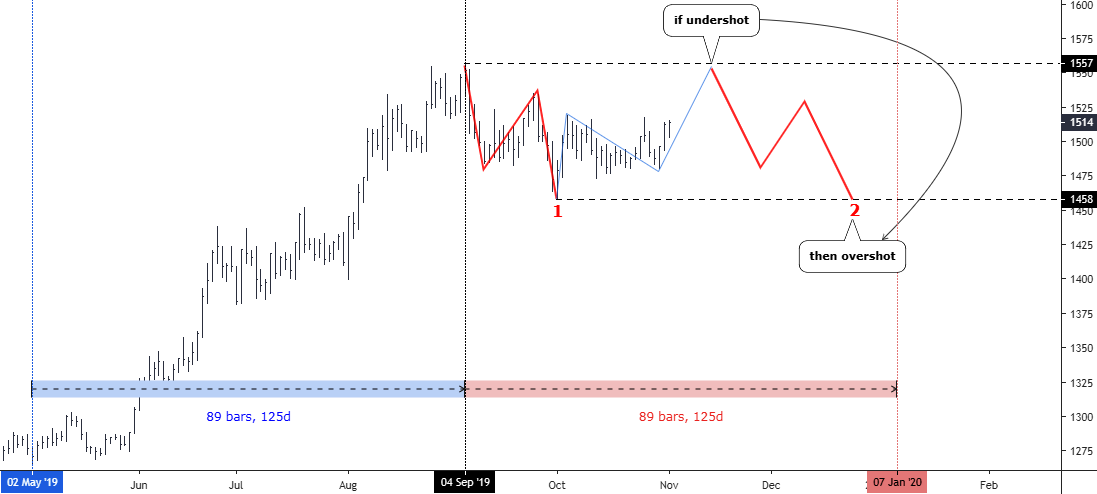
Chart 1. Gold Daily: $1557=>$1458

gold silver
Chart courtesy of tradingview.com

In my earlier post, I shared with you a detailed 4-hour chart of gold with a bullish outlook. Fortunately, the price had indeed gone higher and booked $27 per each ounce since then. I set the confirmation above $1520, which wasn't triggered yet, although we were very close as a high was hit at $1518 at the end of October. Continue reading "Gold & Silver: Beware Of Extended Consolidation"

The Gold Stock Correction And What Lays Ahead

What’s In-Play Now

It has been about 2 months since the gold stock sector, as represented by the HUI index, topped out. The ensuing correction has been a whipsaw affair of ups and downs, but smoothing that volatility out we find an ongoing correction in time and price that has not been too difficult to manage.

The pattern that some would call a “complex H&S” (TA-speak for a freakish pattern with too many shoulders) held a key lower high on the recent bounce to the daily chart’s SMA 50 (blue line). The neckline has been tested (and held) twice since it was created in September and the negative RSI divergence that began last summer has been guiding Huey downward.

hui

It’s all normal and by the chart above you can see the targets, which have been 195 (minor support) and better support at the convergence of a lot of markers, including major breakout support and a gap at 180, the rising SMA 200 (183), a 62% Fib retrace (182) and finally, the pattern’s measurement at around 172. That’s a lot of technical traffic pointing to the 170s-180s for the correction’s ultimate goal, which is to wash out the excess.

And excess there sure was, as we noted well ahead of time in NFTRH using this chart showing how far HUI got ahead of what I consider the most important macro fundamental indicator for the sector, gold vs. stocks and in particular gold vs. the US S&P 500. Continue reading "The Gold Stock Correction And What Lays Ahead"

Gold Update: $1616?

Last month, after gold had missed our primary target of $1577 and then started to collapse, I wondered if "A Bear Face Was Showing Up?". The price was still above the trendline support, although it dipped below $1500. I also spotted the potential reversal Head & Shoulders pattern, which was adding to the possible Bear Face.

Let's see below what you had been expecting from the market these days.

Gold

The most of your votes in the earlier ballot were for the "No" option, which means you didn't think that gold had topped already keeping bullish outlook, no matter what. The thing is that we don't know the right answer yet, as none of the triggers were pushed. To remind you, the Bearish confirmation is only below $1400, and the Bullish one is above $1557.

I want to share with you the anatomy of the failed Head & Shoulders pattern below to show what has gone wrong for educational purposes in the 4-hour chart below. Continue reading "Gold Update: $1616?"

Gold Update: Is A Bear Face Showing Up?

Gold has missed our main target by $20 as it topped at the $1557 on the 4th of September. The gold optimists still benefited nicely as this peak was $67 above the first target of $1490, that we hit more than one month ago. So, it was definitely worth it to keep bullish for one more month.

Let’s see below if there were a lot of gold optimists a month ago.

Gold Poll

Indeed, the majority with a large margin preferred the continuation of the gold’s rally. It means you could book more than $60 for every ounce staying bullish. Thank you for support as I also believed in that outcome.

In the meantime, we should bear in mind that this was just a considerable correction, which had started in December of 2015. It has been retracing the other drop between 2011 and 2015. So, it is evident that the considerable drop and the correction are almost equal in time it took to emerge – 4 years both. Shall we book the recent rally as “done”? Continue reading "Gold Update: Is A Bear Face Showing Up?"

Precious Metals Were Ripe For A Pullback

If you hear one peep out of the gold community about a precious metals “takedown”“attack” or any other such aggressive or war-like language you will then be hearing some old fashioned and promotional gold bug orthodoxy. Fortunately, a casual look around the Bug-o-Sphere does not yield too many obvious conspiracy theorists or importantly, cheerleaders.

Indeed, it seems that all too many bugs expected this correction in gold, silver and the miners. That is a good thing because when the real top comes these ladies are going to be out front and greed will be running rampant (quite possibly against a negative fundamental or valuation backdrop as in 2008).


Instead, everybody, it seems knew about the high-risk Commitments of Traders situation for gold and silver. The CoT is not a timer, but for weeks now it had been a condition that’s been in place for a correction. It’s not a “takedown”, it’s a condition of too much speculation that had to be addressed. Now it is. Other CoT data available here.

gold cot

silver cot

As the CoT, Hulbert’s HGNSI and the extreme overbought readings first in the gold price, but then dynamically in the silver price and the miners gathered to form a high-risk situation, the time to take some profits was over the last couple of weeks, not now. Gold oriented newsletters appear to have jerked over bullish with the latest head-fake rise in the gold price. Continue reading "Precious Metals Were Ripe For A Pullback"