Commodities: Sell In May And Go Away?

Aibek Burabayev - INO.com Contributor - Metals - Sell In May And Go Away


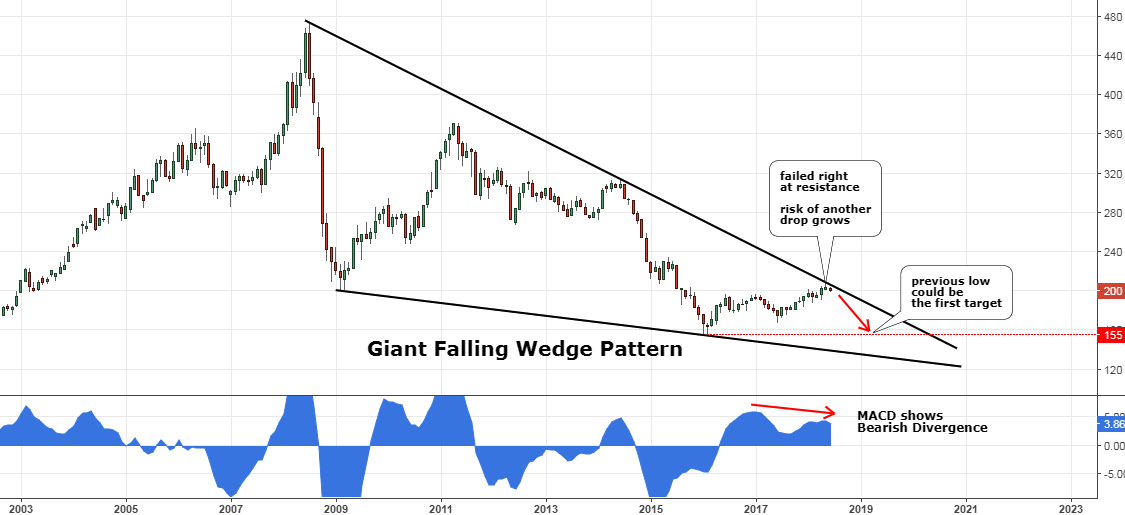
Last August I posted a chart analysis of one particular commodity market index as I spotted an interesting pattern. As time goes by, we can see how my outlook emerged and after almost a year the market reached another crucial milestone or better yet a decision point.

This index is called The Thomson Reuters/CoreCommodity CRB Index (CRB). It is the gauge of the commodities market, which is comprised of 19 commodities: Aluminum, Cocoa, Coffee, Copper, Corn, Cotton, Crude Oil, Gold, Heating Oil, Lean Hogs, Live Cattle, Natural Gas, Nickel, Orange Juice, Silver, Soybeans, Sugar, Unleaded Gas, and Wheat.

So, if you watch commodities market, then the two charts below could be of strong interest to you.

Chart 1. Thomson Reuters/Jefferies CRB Index Monthly: Failed At Resistance
Sell In May And Go Away
Chart courtesy of tradingview.com

Above is an update of the earlier chart. The risk/reward that time ($182) favored a long position as the upside target at the major top ($474) promised to cover risk extensively amid oversold market conditions. Continue reading "Commodities: Sell In May And Go Away?"

Silver Looks Into The Dark Abyss

Aibek Burabayev - INO.com Contributor - Metals - Silver


I hadn't updated the silver chart since February when I warned you that the metal dangerously approaches the support of the Triangle pattern. After that, I posted a gold update as I found an amazing historical similarity there.

There’s been so much water under the bridge since February, but nothing had changed in the precious metals markets until the end of last month when the crucial trigger was pulled.

Below is an updated chart of the silver that I would like to share with you these days as it contains an excellent trading opportunity.

Silver Weekly Chart: Triangle Was Broken Down

LLLL
Chart courtesy of tradingview.com

Silver could escape from that troubled situation which I pointed out in February as the price briefly punctured the downside of the Triangle pattern (orange) and then happily reversed higher on the back of broad dollar weakness. Continue reading "Silver Looks Into The Dark Abyss"

S&P 500 Finishes Consolidation, Fasten Your Seat Belts!

Aibek Burabayev - INO.com Contributor - Metals - S&P 500 Finishes Consolidation


This past February, I drew your attention to the S&P 500 index, which started a consolidation, addressing two critical questions about the future of the index. The most important answer said that we are still in the long-term uptrend and we should keep patience to see the end of the consolidation.

Later in April, I shared an update with you with a detailed plan for two possible options of the ongoing consolidation. The first one implied the development of the familiar Triangular pattern, which in its turn had two possible paths of price action. And the second path with a zigzag inside of the Triangle was drawn with an amazingly accurate prediction as the index just repeated its trajectory.

Another possible option was described within the forecasted Bull Flag pattern. This model didn’t develop as planned as the price couldn’t break below the previous low at $2532; although we were very close to hitting it as the index’s drop reversed just $31 ahead of it at the $2553 level. This plan is very close to invalidation once the price overcomes the earlier top at $2718.

Below I prepared an update of the most valid option for you. Continue reading "S&P 500 Finishes Consolidation, Fasten Your Seat Belts!"

The S&P 500 Has Two Options

Aibek Burabayev - INO.com Contributor - Metals - S&P 500


Back in February, I shared a map for the possible development of a consolidation that started at the end of January in the S&P 500 index. The expected drop followed the post although a little bit postponed.

As top metals are literally dead and still between the confirmation levels these days, I would like to update a lively S&P 500 index chart. For the gauge of American stock market, I prepared two separate charts as it has reached the crucial support and we could have two future options here.

Chart 1. S&P 500 Weekly: Make It Or Break It

S&P 500
Chart courtesy of tradingview.com

In the monthly chart from my earlier post I added the orange, medium-term support, which I highlighted in black in the weekly chart above. As we can see, that support already stopped the previous drop in February and did it again at the end of March. If the price would freeze at these levels without breaking below the former trough, then the Triangle pattern (orange) could develop as lower highs and higher lows shape it. Continue reading "The S&P 500 Has Two Options"

S&P 500 Consolidates, Is Another Drop Ahead

Aibek Burabayev - INO.com Contributor - Metals - S&P 500 Consolidates


In this post, I will share with you two maps as the S&P 500 consolidates to address two questions that are probably on your mind these days. The first is related to the long-term trend, shall we consider that significant ten percent drop that started at the end of January as a threshold for the long-term Bear Face? And the second question is related to the current situation, will this robust recovery continue further?

Let’s be diligent and answer those questions one by one.

Chart 1. S&P 500 Monthly: Consolidation Not A Reversal Yet

S&P 500 Consolidates
Chart courtesy of tradingview.com

First of all, I would like to draw your attention to the black long-term trendline support, which starts post Great Recession period. The S&P 500 is far above this trigger, and I guess that even the current consolidation could hardly reach it. So, for the long term Bear Face to start sellers should push the index below that trendline, which currently sits at the $2100 mark. As this is not the case now, there is no reason for panic then. Continue reading "S&P 500 Consolidates, Is Another Drop Ahead"