Silver Begins Big Upside Rally Attempt

The move we saw in Silver early this week to new 6-year high price levels, above $22.60, is quite likely the biggest upside move in Silver since the bottom in March 2020 – after the US stock market collapsed because of the COVID-19 virus event. This new rally in Silver is likely the move we’ve been suggesting to our followers relating to a series of measured upside price moves totaling approximately $5.30 in each advance.

As traders, watching bonds accelerate moderately higher as the US Dollar falls and the stock market attempts new lofty levels, we are intrigued by the move in metals because it suggests a large segment of investors believe a bubble is nearing very peak valuation levels. The only reason metals, particularly Silver, would be accelerating as it has recently is that traders have suddenly adopted a stronger demand for second-stage hedging of risk.

Gold is the traditional hedge for many traders in times of risk. Silver, being the second-tier hedge, typically start to rally 4 to 6+ months after Gold begins to move substantially higher. Gold is currently trading near all-time highs – near $1820. Silver just recently bottomed in March 2020 near $11.65 and has rallied more than 70% to current levels – above $20.35. If our research is correct, Silver will rally to levels above $26 within this current upside rally.

The multiple measured moves in Gold and Silver suggest waves of price advances happen in a series of structured upside price moves. We believe this current upside move in Silver will push price levels above $26 per ounce. If Gold continues to rally as Silver rallies, then future measured moves should target $31.50 and $36.75 in Silver – possibly higher. Continue reading "Silver Begins Big Upside Rally Attempt"

Gold And Silver Could Diverge

At the beginning of this month, I shared a warning alert as the silver chart had a Bearish divergence. The trigger was set below 50 on the RSI. It wasn’t activated, and gold and silver moved higher. Moreover, silver finally hits the target. The majority of readers kept a bullish outlook and got it right.

I prepared an update for you with the bonus chart at the end, so stay tuned.

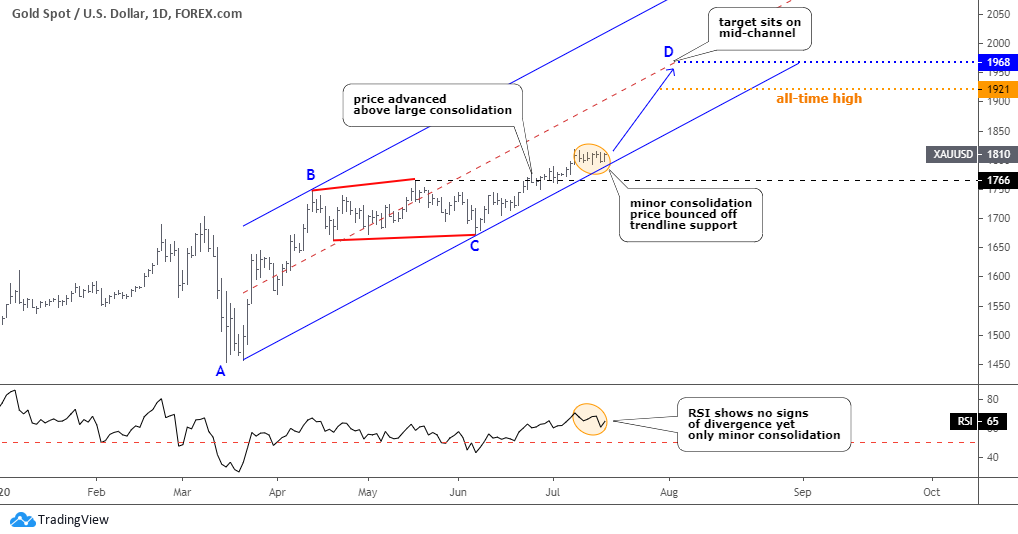
Let’s start with the daily gold chart.

Gold Chart

Gold is slowly moving to the upside. It hasn’t shown any bearish signs as of yet. The metal finally elevated above the top of the preceding large consolidation beyond $1766 (black dashed line), eliminating the option of another leg down within an even more extended consolidation. Continue reading "Gold And Silver Could Diverge"

"Diamond" Pattern Pushed Gold To Sky Vs. Silver

I appreciate active readers of the Blog for leaving valuable comments on Gold and Silver posts. Recently, there have been a lot of thoughts shared not only about the metals itself but also about its relationship reflected in the dynamics of the Gold/Silver ratio. I think it’s time to talk about it in this post. Please feel free to enrich this piece with your valuable thoughts in the comments section.

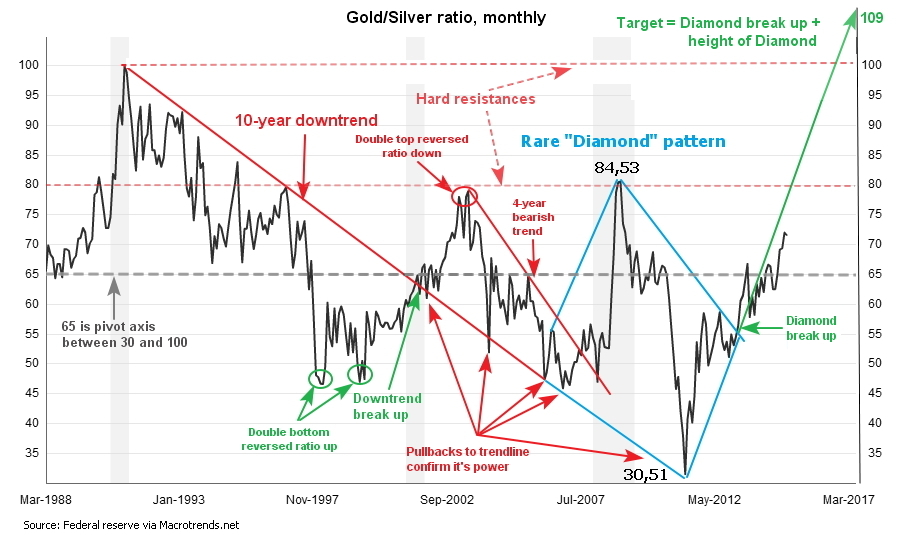
Back in December 2014, I shared only the third post here on the Blog. The title was more appropriate for a science fiction novel as it promised the “journey to the Moon” for the Gold/Silver ratio as it was going to hit the 109 ounces. Below is that very chart from the distant 2014 to refresh the memory.

gold silver

The idea was based on the “Diamond” pattern spotted on the monthly chart (blue). The target was reached more than five years later on the 16th of March this year. The total gain is equal to 109 - 72 = 37 troy ounces of silver per troy ounce of gold or 51% in five years.

Let’s see in the weekly chart below the ratio dynamics after that post. Continue reading ""Diamond" Pattern Pushed Gold To Sky Vs. Silver"

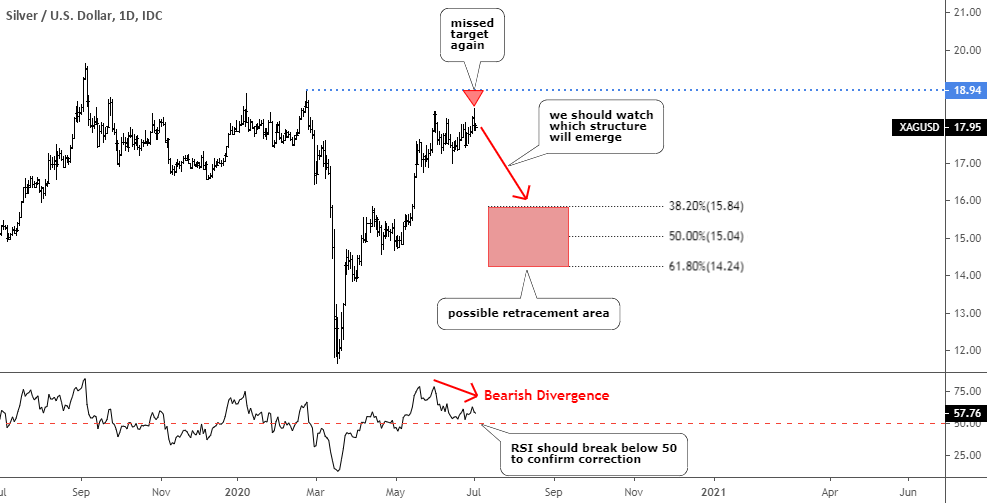
Silver Could Take Gold Down With Bearish Divergence

I was watching top metals closely as their price dynamics didn’t convince with sharp zigzags up and down, which are more appropriate during market consolidations, not trends. When silver hardly tagged the former top on the 1st of July, I got cautious. So, this post is aimed to share with you a warning alert for top metals as I spotted a Bearish signal on the silver chart. I will start with its daily chart below to show you the details.

Silver
Chart courtesy of tradingview.com

“Silver was a gamechanger” in April as then it finally revealed its structure with a sharp drop and the following V-turn, which indeed changed the game for both top metals since then. This time again, it shows a leading Bearish indicator ahead of gold. Continue reading "Silver Could Take Gold Down With Bearish Divergence"