This week we have a stock market forecast for the week of 2/27/2022 from our friend Bo Yoder of the Market Forecasting Academy. Be sure to leave a comment and let us know what you think!
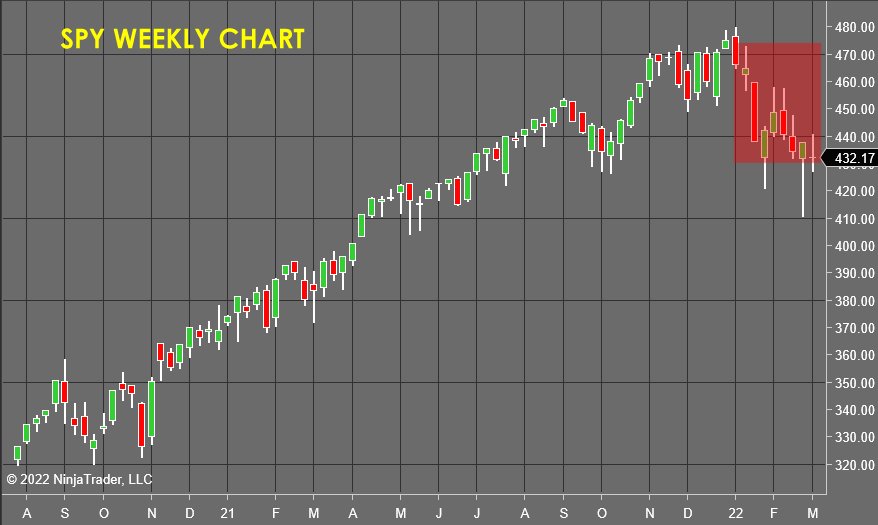
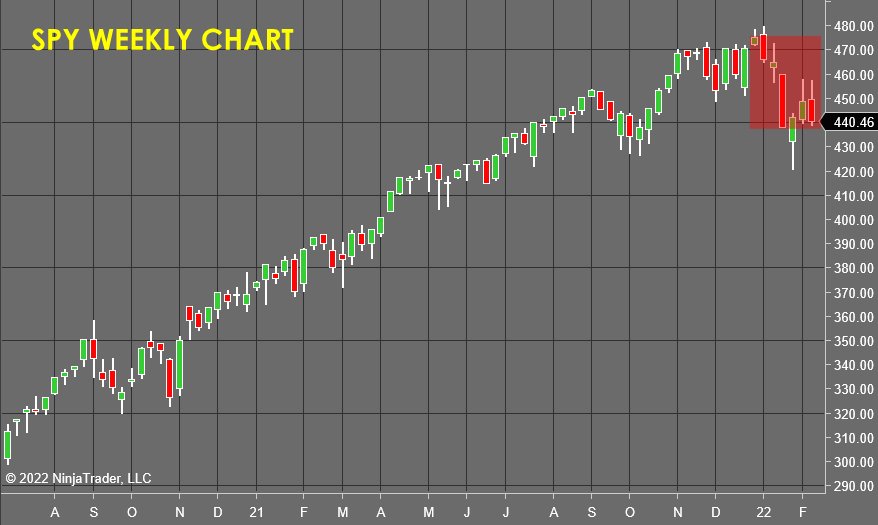
The S&P 500 (SPY)
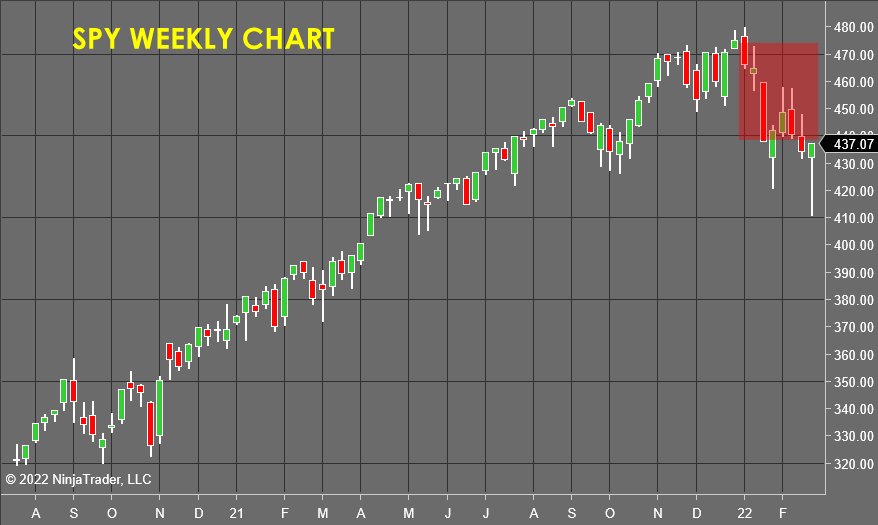
This has certainly been a busy week! A Russian invasion of Ukraine, radical movement in the markets, the precious metals, forex, and crypto.
As I said in my last forecast, the markets are at a testing point. We have deeply bearing energy all coming into synchronicity in the deepest timeframes, and for all practical purposes, we should expect a sustained bear market as we correct and digest the large gains of the past few years.
But we saw another "rescue package" show up on Thursday as wild gaps at the open turned tail and whipped back in the opposite direction.
I have two options right now.
The first is to say, "The Fed just showed its hand, and the fix is in," in which case I would be best served to go flat and look for exposure in the opposite direction.
The second is to say that the spasmodic price action of Thursday wasn't followed by a surge of enthusiasm all day on Friday going into the weekend. Instead, the market popped up in the morning, then drifted listlessly through the rest of the day and into the close. This lack of follow-through tells me I'm not dead yet and that I need more data from next week's trading to KNOW for sure whether there is a new "pump" happening, or was Thursday just a one-day knee-jerk reaction to the news of war in Ukraine.
I'll plan to sit tight in SPY, take some profits off the table in other areas and make a more accurate determination next week.
SPDR Gold Shares (GLD)
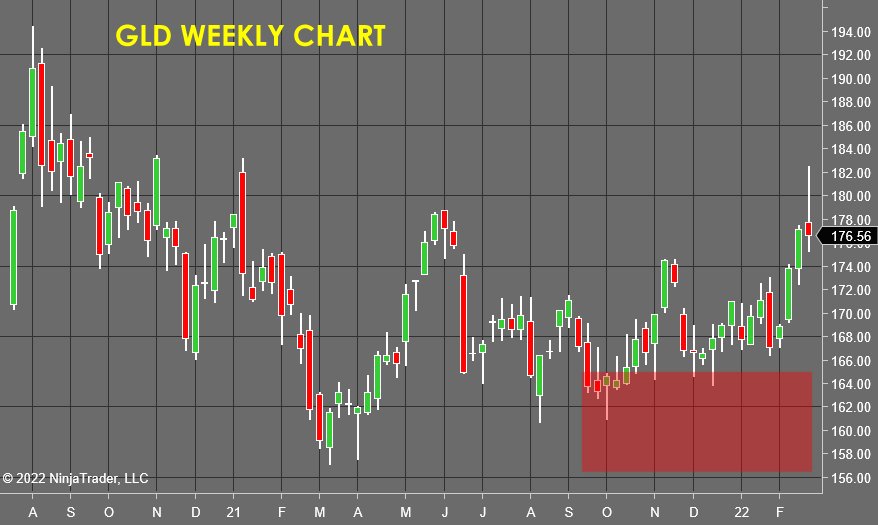
Gold finally heated up and broke a major line in the sand in this market at $180 per share. It rallied a bit higher than was totally rejected... leaving an enormous "tail" on the weekly candlestick.
We are looking at a better than 1:1 open profit, and there is a 50% chance that price whipsaws back to test the $165 level, so I think it's time to lock in gains and watch this market for a re-entry after the whipsaw has burned itself out.
iShares Silver Trust (SLV)
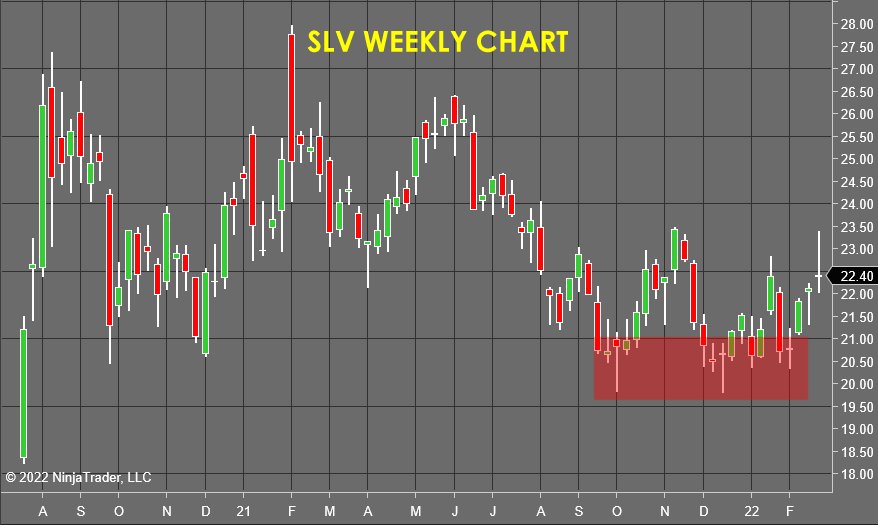
The weekly chart of Silver looks a lot like gold, but with some key differences which make me comfortable holding to my original forecast, we are going to break out and run.
The first thing is that this market survived its bearish attack a few weeks ago, and the selling pressure was rejected to form a higher low on the weekly chart.
Second, while the "tail" looks scary, price DID NOT break out like gold did, so the rejection isn't as impactful and will provoke a smaller reaction, so I plan to sit tight and see what next week's action tells me.
LKQ Corporation (LKQ)
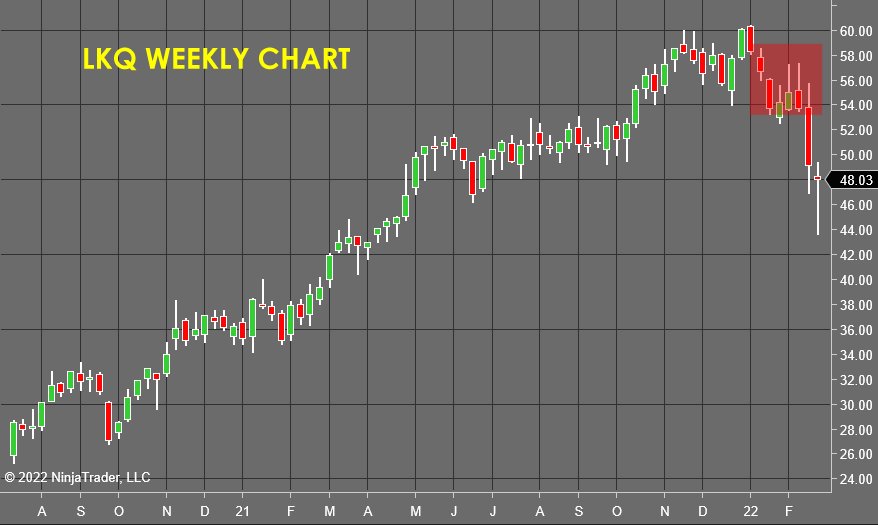
LKQ Corporation offered an "easy money" dump the likes we haven't seen in a while. While I still see lower prices, my forecast is that this will take a while, so it's time to cash the ticket and take some risk off the table as we deal with the uncertainty of the geopolitical game of chicken that Putin is playing with NATO, the US and the UN, which should heat up next week.
Stay frosty; there should be some wonderful intraday trends if you are watching the market closely!
To Learn How To Accurately and Consistently Forecast Market Prices Just Like Me, Using Market Vulnerability Analysis™, visit Market Forecasting Academy for the Free 5 Day Market Forecasting Primer.
Check back to see my next post!
Bo Yoder
Market Forecasting Academy
About Bo Yoder:
Beginning his full-time trading career in 1997, Bo is a professional trader, partner at Market Forecasting Academy, developer of The Myalolipsis Technique, two-time author, and consultant to the financial industry on matters of market analysis and edge optimization.
Bo has been a featured speaker internationally for decades and has developed a reputation for trading live in front of an audience as a real-time example of what it is like to trade for a living.
In addition to his two books for McGraw-Hill, Mastering Futures Trading and Optimize Your Trading Edge (translated into German and Japanese), Bo has written articles published in top publications such as TheStreet.com, Technical Analysis of Stocks & Commodities, Trader's, Active Trader Magazine and Forbes to name a few.
Bo currently spends his time with his wife and son in the great state of Maine, where he trades, researches behavioral economics & neuropsychology, and is an enthusiastic sailboat racer.
He has an MBA from The Boston University School of Management.
Disclosure: This article is the opinion of the contributor themselves. The above is a matter of opinion provided for general information purposes only and is not intended as investment advice. This contributor is not receiving compensation for their opinion.
