Weekly Stock Market Forecast

This week we have a stock market forecast for the week of 11/7/21 from our friend Bo Yoder of the Market Forecasting Academy. Be sure to leave a comment and let us know what you think!

The S&P 500 (SPY)
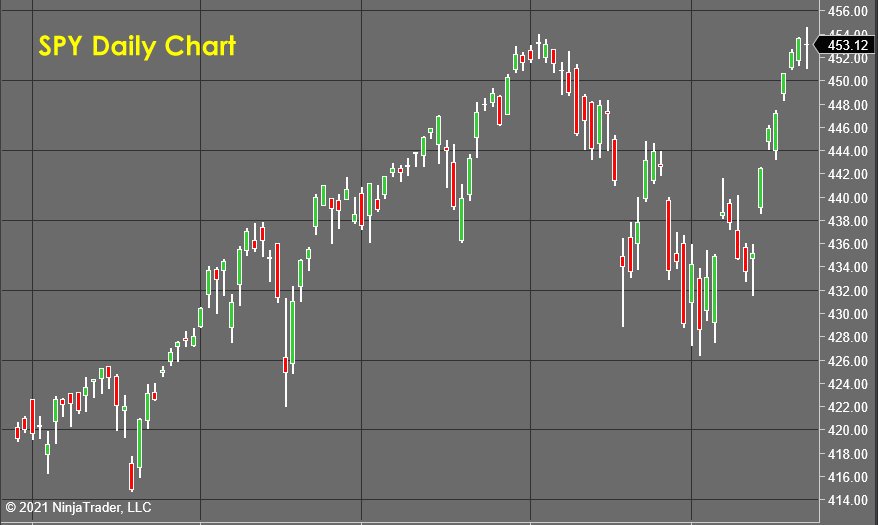
SPY Weekly Chart - Stock Market Forecast

It’s so destructive what the Fed is doing, and their “crystal meth” jacked right into the market's veins had the expected effect. This injection of demand overwhelmed the available supply and we have “doinked” higher.

I can’t analyze and forecast a market with accuracy where politics and policy trump human behavior models and basic supply and demand.

The intraday markets in the S&P remain solid. I had back-to-back winners today and produced double-digit gains.

Average holding time? Continue reading "Weekly Stock Market Forecast"

Weekly Stock Market Forecast

This week we have a stock market forecast for the week of 10/31/21 from our friend Bo Yoder of the Market Forecasting Academy. Be sure to leave a comment and let us know what you think!

The S&P 500 (SPY)

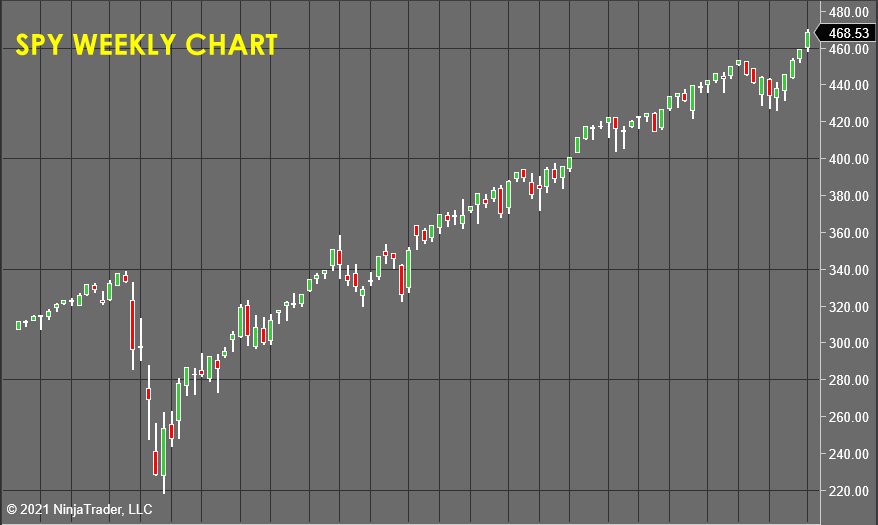
SPY Weekly Chart  - Stock Market Forecast

This week we have seen a lot of conflict between the bears and bulls, and when we look at the weekly chart above. It seems the bulls have won this week as a small green candlestick seems to "confirm" the bullish breakout.

To understand this better and get a more precise view of supply and demand pressures, we must look at the market in a more granular manner. Continue reading "Weekly Stock Market Forecast"
Bitcoin Hits The Target, What's Next?

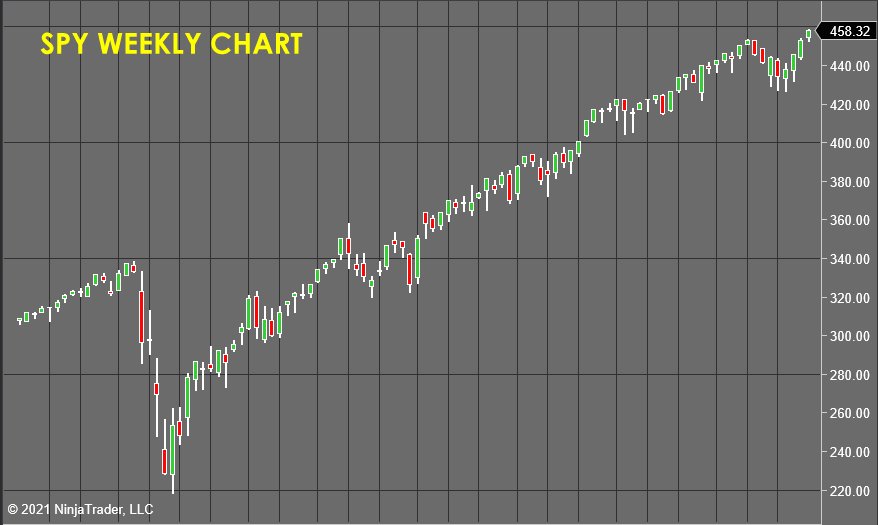
Last Wednesday, Bitcoin rallied to its highest price ever, reaching just over $67k. The minimum bullish target at the previous all-time high that was preset at the start of the month has been hit. The majority of readers guessed it right.

Did you book the profit?

View Results

Loading ... Loading ...

What's next? I see at least two opposite perspectives. Let us see them one by one.

Bitcoin Daily Chart

The chart above is based on the assumption that the next significant move is kicking off now after a considerable retracement from April to June this year. Continue reading "Bitcoin Hits The Target, What's Next?"

Weekly Stock Market Forecast

This week we have a stock market forecast for the week of 10/24/21 from our friend Bo Yoder of the Market Forecasting Academy. Be sure to leave a comment and let us know what you think!

The S&P 500 (SPY)

SPY Daily Chart - Stock Market Forecast

The time is finally here...

SPY has to choose what to do next. Continue reading "Weekly Stock Market Forecast"
$4550 Is Critical Resistance For The S&P 500

Two main factors are driving the rally in the US stock markets recently; retail traders buying the dip, and Q3:2021 earnings data is starting to shake away the concerns that resulted in the recent market rotation. Combine these activities with the start of the Christmas Rally phase (which usually starts sometime after mid/late-October and carries through into early January), and we have the making of a moderately strong potential price rally in the US major indexes over the next 60+ days.

The $4550 Level Is Critical Resistance For The S&P 500

I’m highlighting this ES Daily and Weekly chart pattern, below, to share with you how important it is to see the ES break above the $4550 level – the past high price peak. If the markets are going to start a new rally headed into the 2021 Christmas season, then we need to see the ES continue to rally and break above the $4550 level. It is critically important that price breach the $4550 level and attempt a strong move higher if this bullish momentum persists.

The ES has already broken above three previous Stand-out Highs, drawn in MAGENTA. This shows the strength of a bullish price advance and building bullish price momentum. Yet, the final price high, near $4550, is critically important from a technical standpoint. Continue reading "$4550 Is Critical Resistance For The S&P 500"