Dollar, Gold And Silver: The Market Takes A Break

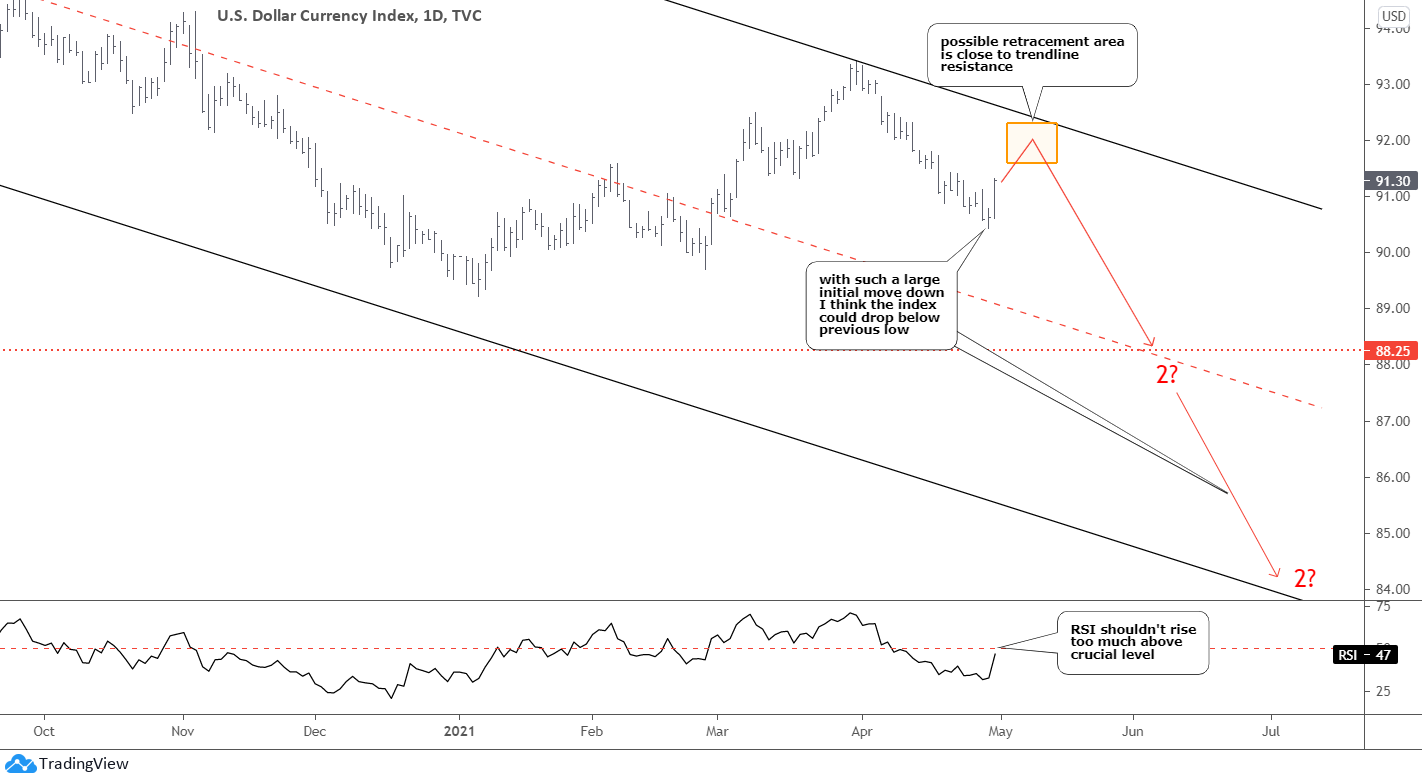
The market does not move in a straight line. I anticipated a correction to start in the U.S. dollar index (DXY) as it moved down too far without a break, and it came at the end of last week. Traders decided to book some profit ahead of a weekend, pushing the price of the dollar higher.

U.S. Dollar Index Daily Chart

I highlighted the possible retracement area between 38.2% and 61.8% Fibonacci levels with the orange rectangle within the 91.60 - 92.30 range. The dollar nears the first resistance. The top of the rectangle is very close to the trendline resistance, making it a fortified barrier. Continue reading "Dollar, Gold And Silver: The Market Takes A Break"

Gold & Silver: The Dollar Shows The Way

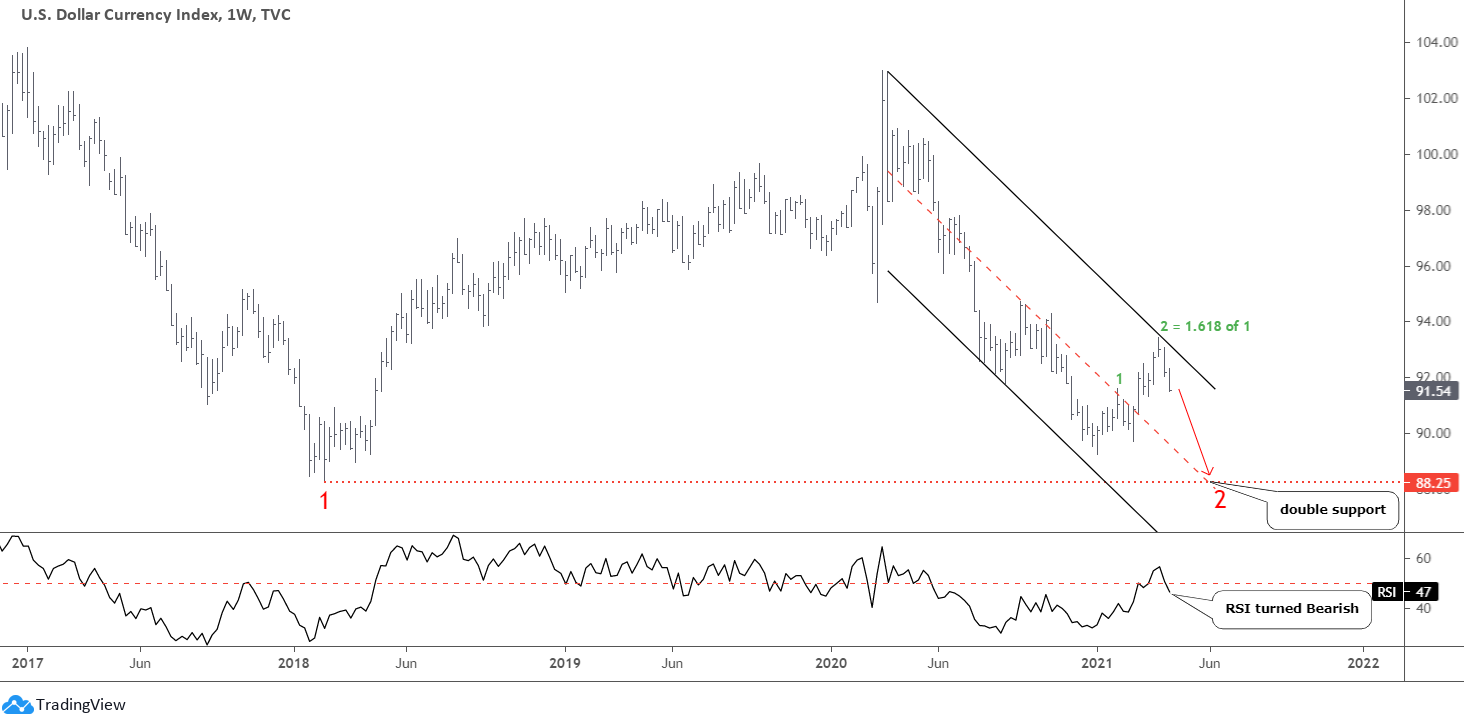
The U.S. dollar index (DXY), aka “King,” has a clear structure in its chart as it moves accurately according to the plan posted at the beginning of the month. Most of you supported the idea that the dollar will show another drop.

King Dollar Weekly Chart

The green leg 2 of the pullback traveled 1.618 of the distance of the first green leg up and touched 93.44 at the top. Then, the price quickly reversed down to drop like a rock. The last week’s bar closed at the minimum as selling pressure persisted. I switched to a weekly time frame to show you how accurately the current second leg down repeats the path of the first leg down.

This time, after the price went deep down, I built the black downtrend channel through the recent peak. We can see the magic of the trend here as the mid-channel accurately intersects the valley of the first leg down at 88.25 to offer double support for the price.

The RSI turned Bearish following the brief roll over the crucial level. It confirms the downward outlook.

This predictability of the dollar dynamics made me reconsider the gold chart below. Continue reading "Gold & Silver: The Dollar Shows The Way"

Bitcoin Nears Trigger, AAPL Set To Rally

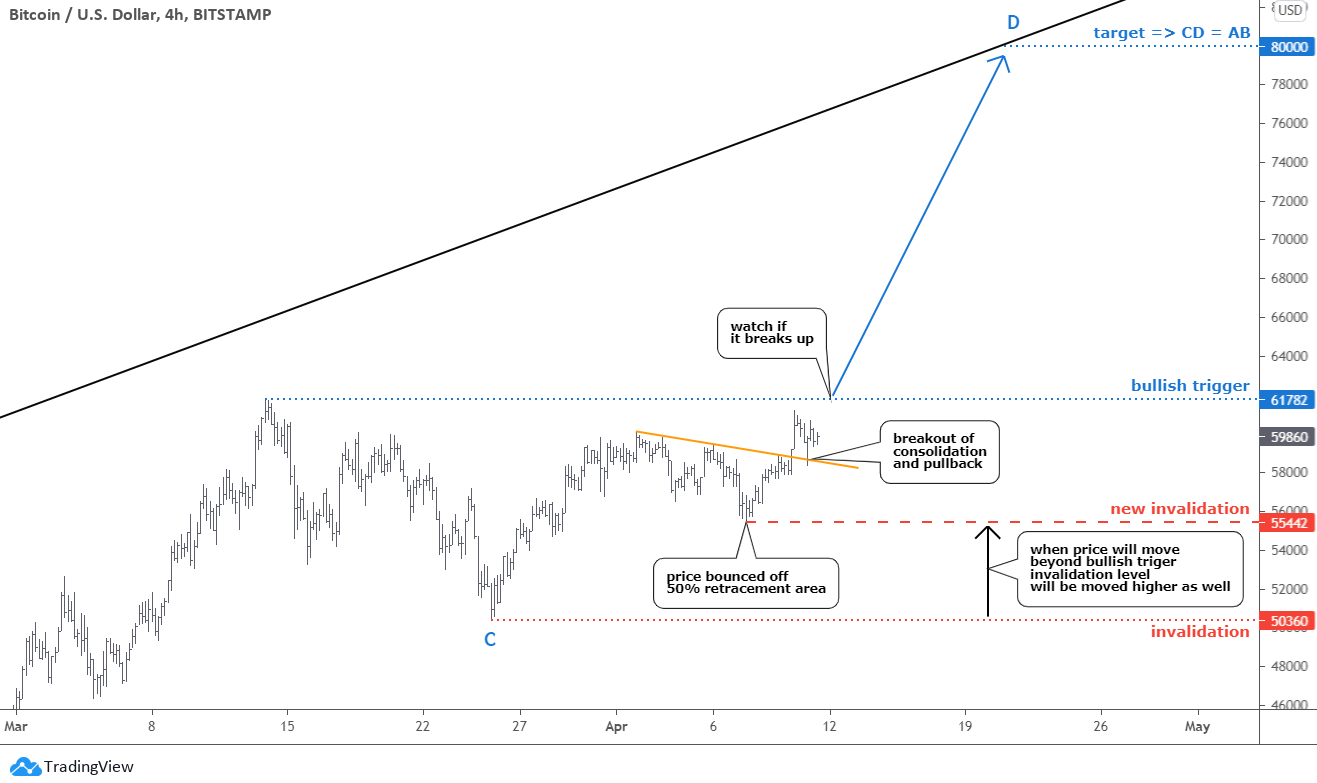
A sleepless Bitcoin moves accurately as per the plan posted last week. The majority of you agreed that the $80k target is achievable for the leading coin. Here is an updated chart below where I zoomed in to a 4-hour time frame to share more details with you.

Bitcoin Price Chart

As I said before, Bitcoin's chart structure builds similarly with conventional trading instruments these days. The forecasted correction reached the 50% Fibonacci retracement level in the $55k area. It stopped there as the price bounced up and hit the orange trendline resistance soon. Continue reading "Bitcoin Nears Trigger, AAPL Set To Rally"

Bitcoin, Dollar, Gold And Silver Update

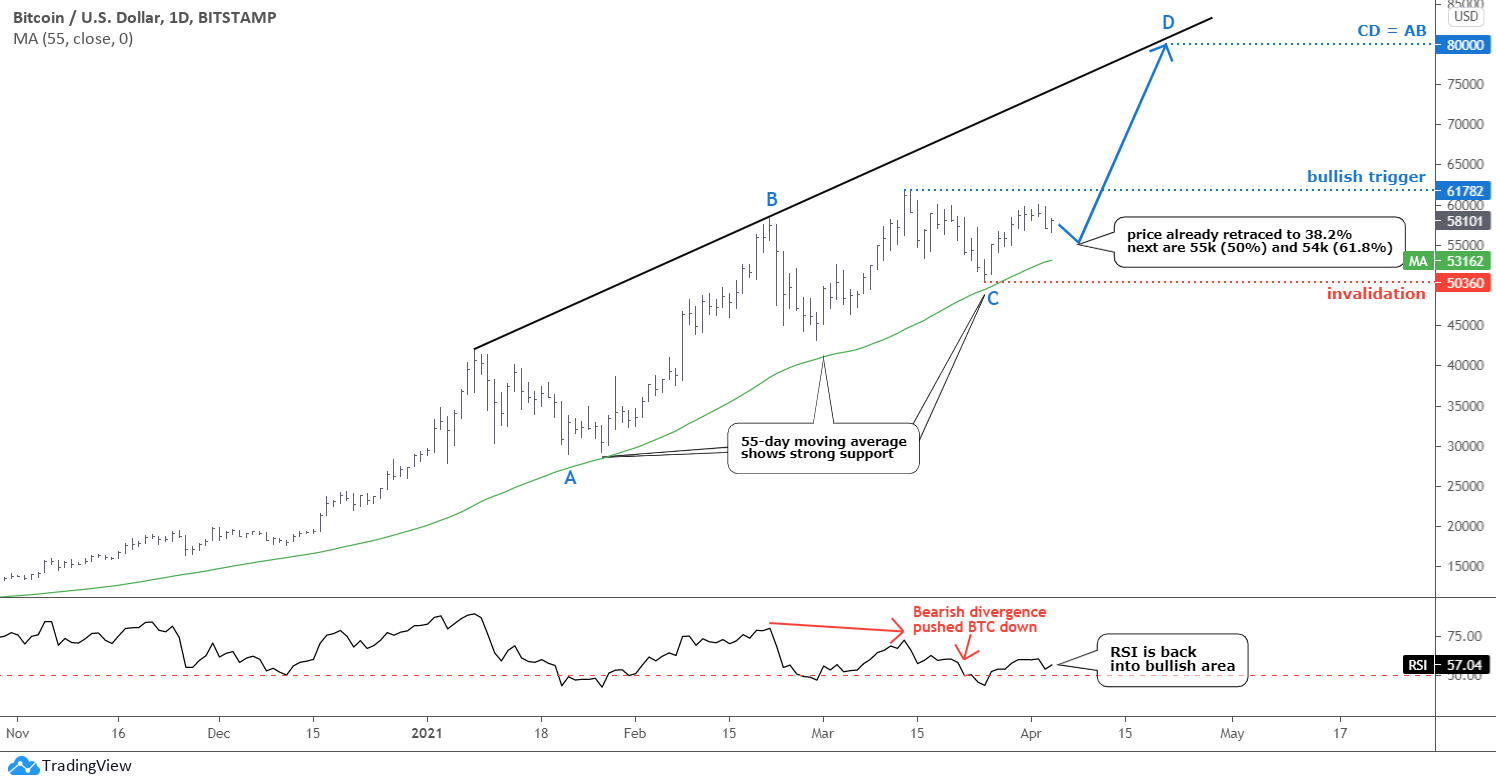
As Bitcoin matures, the chart structure becomes more readable over time. We can see how such a conventional indicator as a moving average perfectly supports the price. I added a 55-day (Fibonacci number) moving average (green), which at least three times this year kept the price in the bullish mode that started last October when the price crossed this line to the upside.

Another popular indicator RSI has perfectly detected the Bearish Divergence and pushed the price down last month. After that, it moved back above the crucial 50 level, which supported the current upward move.

Daily Bitcoin Chart

I see possible AB/CD segments in the chart (blue labels). The BC consolidation was huge and complicated, but it could be over now. If the CD segment travels the same distance as the AB part, then the price of Bitcoin could hit the new all-time high of $80,000. The projection of the black trendline resistance confirms that ambitious target, and we know how powerful the trends are. Continue reading "Bitcoin, Dollar, Gold And Silver Update"

Gold & Silver: Dollar Is Going Down

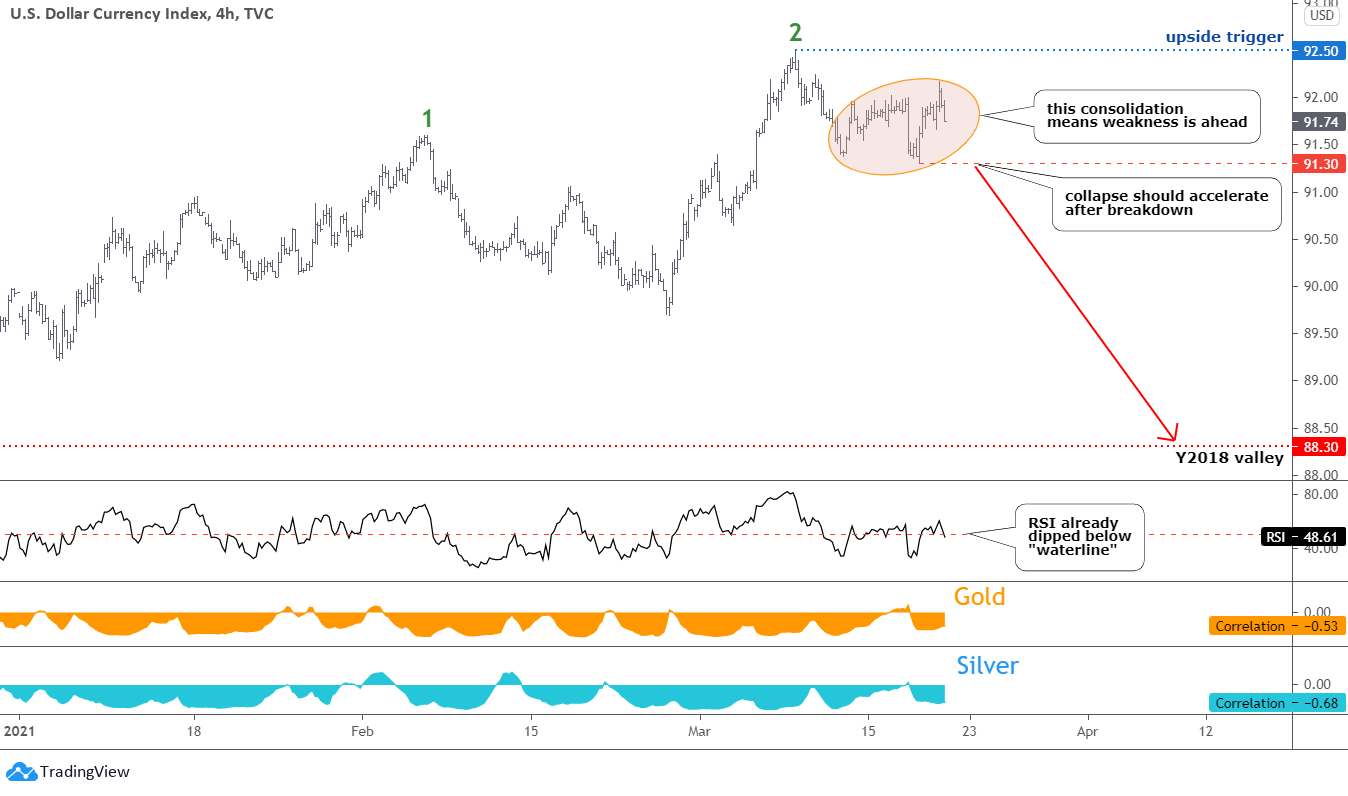
U.S. dollar index (DXY) 4-hour chart

Dollar Index

Last time the chart structure of the dollar was less clear; hence I put two opposite scenarios in the chart with triggers.

As time goes by, the market reveals itself more clearly. The DXY price built a familiar two-leg consolidation highlighted with the orange ellipse. It follows the preceding move down from the recent peak of green leg 2. It means further weakness is ahead. I put the trigger on the 91.30 mark (bottom of the minor consolidation) for confirmation. The target remains intact in the area of the Y2018 valley. Continue reading "Gold & Silver: Dollar Is Going Down"