Stock market price action is usually conducted in a series of up and down price phases – or waves/cycles. Typically, price will move higher or lower in phases- attempting to trend upward or downward over time. This type of price action is normal. Extended upward trends with very little downward price retracements happen sometimes – but not often. They usually happen in “excess phase” rallies or after some type of news event changes expectations for a symbol/sector.
Putting Concerns Into Perspective – Still Bullish
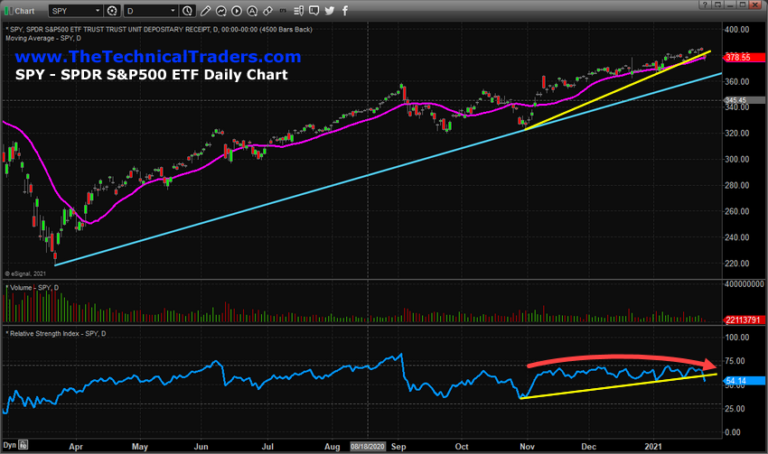
Since early November 2020, the US stock market has continued to rally in a mode that is similar to an excess phase rally – showing very little signs of moderate price rotation. While price volatility has continued to stay higher than normal, you can see from the SPY Daily chart below that it has rallied from $324.40 to $385.95 (over 18%) in just under 90 days. At some point in the future, a moderate price rotation/retracement will happen that may be in excess of 6% to 11% – as has happened in the past.

The purpose of this research post is to alert readers that the markets appear to have started a period of downside price rotation – which is normal. This SPY Daily chart, above, highlights the upward support channel originating from the March 21, 2020, COVID-19 lows (CYAN line) and also the upward support channel originating from the early November 2020 lows (YELLOW line). Continue reading "U.S. Stock Market Rolls Lower"


