USDJPY: Reversal or Setback?

Back in September, I shared with you my take on the USDJPY currency pair based on 360° view. A combination of fundamental factors and technical factors has supported the continued strength of the U.S. dollar relative to the Japanese yen.

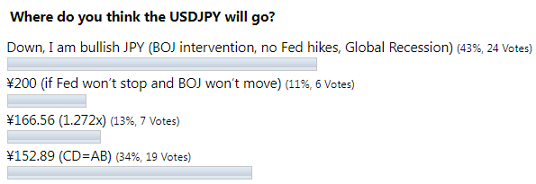
However, the majority of readers predicted the opposite, as you can see in the screenshot below.

Poll Results

As the second largest vote played out the best, the USDJPY has soared more than six percent to reach a peak of ¥151.94. The previous time this level appeared on this chart was in the summer of distant 1990, two decades ago. That move was close to hit the CD=AB target at ¥152.89, however it has lost the momentum.

The pair has lost more than it gained in that call and there is a question, is that all or are we just in a large correction?

I prepared for you another bunch of visualizations below to answer that question.

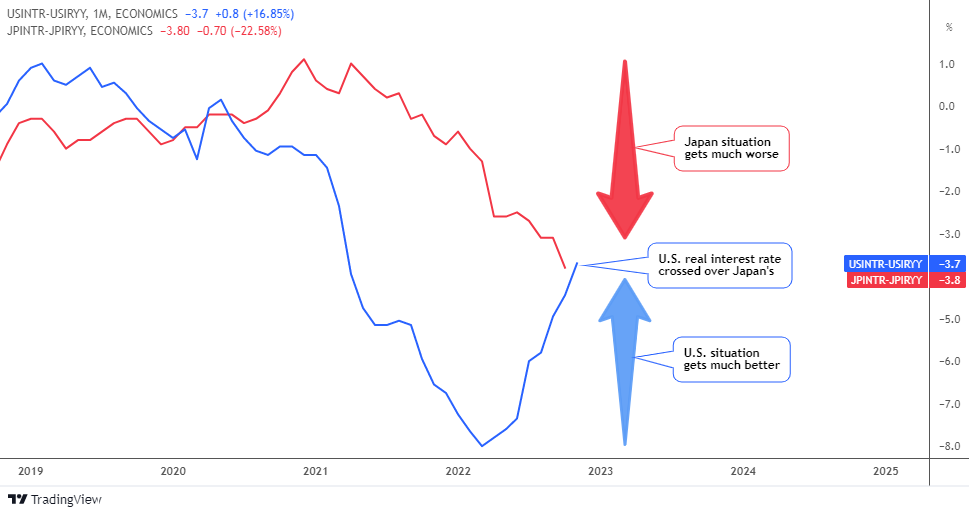
Let’s start with the fundamentals first in the interest rate comparison below.

US vs JP Real Interest Rate

Source: TradingView

Continue reading "USDJPY: Reversal or Setback?"

You Better Know When To Walk Away

This week’s investor insight will make you think twice about the current stock and bond rally as we head into the end of the year.

We get a lot of questions about if the stock market has bottomed or if it is headed lower and how they can take advantage of the next Major market move. Over the next 6 to 12 months, I expect the market to have violent price swings that will either make or break your financial future. So let me show a handful of charts and show what I expect to unfold.

Let’s dive in.

We’re told that “quitters never win.” But is it always wise to stick with something when it no longer serves us or, worse, continues to harm us?

Many years ago, when Texas hold’em poker was big and online gambling was allowed in Canada, I used to run a poker league and build custom poker tables for people across the United States and Canada. I love poker, and I still play it to this very day, but the game does require skill, a proper mindset, and self-discipline. Without all three of these things, poker is pure gambling. It’s the same when it comes to active trading or investing if you lack the skills, mindset, and self-discipline.

Retired professional poker player Annie Duke, who is also a best-selling author, and decision strategist who advises seed-stage Startups, says that learning when to quit is a critical skill, especially for investors.

Annie states, “Quitting is a good thing when applied at the right time.”

If you’ve been following me for any time, then you know I follow a detailed trading strategy with position and risk management rules. As a result, you won’t find me taking random trades or trading based on emotions. Instead, you’ll find me patiently waiting on the sidelines for a high-probability trade signal to reinvest my capital.

I trade differently. I don’t diversify. I don’t buy-and-hope, and I don’t have any positions at certain times.

What I do is reinvest in assets that are rising in value. And when a particular asset stops moving higher, I give up on the position and exit it immediately. Because I use technical analysis to follow price action, we can quickly and easily determine if an asset is rising or falling. Therefore, I can step aside and let the asset fall and look for a new opportunity that is rising, or hold the falling position and ride it lower for who knows how long…

Unfortunately, most traders and investors do not understand how to read the markets, or they don’t have control of their money. They are at the mercy of what the market does or the skills of whoever controls their capital. Continue reading "You Better Know When To Walk Away"

Crypto Update: This Major Coin Could Bounce

It is time to update the crypto charts as I spotted one strong alert in a major coin for you.

Let me start with the charts showing the balance of power in the crypto-sphere. The two majors will be first.

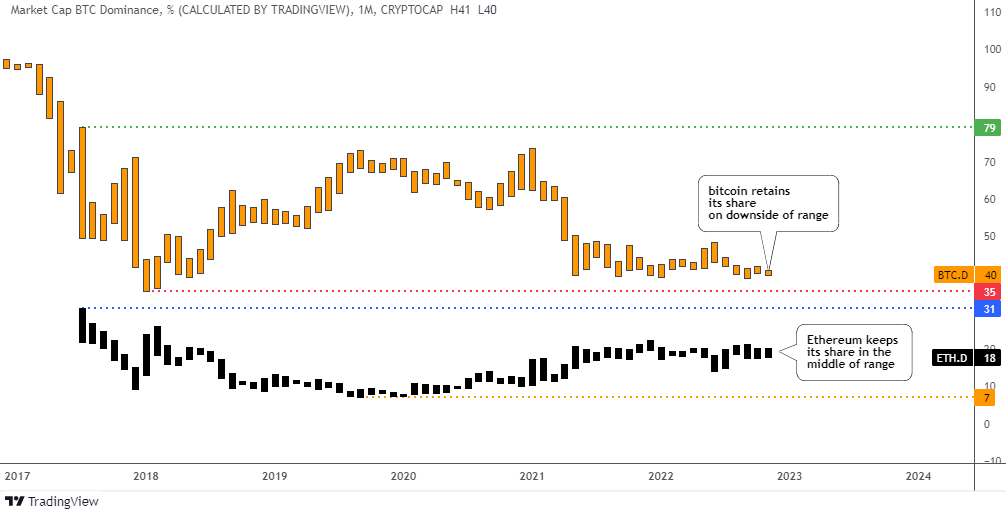
Bitcoin vs Ethereum

Source: TradingView

In spite of the so-called “crypto-winter” in the market, these two mastodons have kept their stranglehold on both individual and combined market share.

Bitcoin’s market share (orange bars) remains stable at 40% of the market no matter what. However, it is located on the downside of the range as other coins have taken their place in the sun. The all-time low was recorded at 35% in distant 2018.   

Ethereum’s dominance (black bars) is also solid at 18%. It saw a high market share of 31% at the beginning of its life. Currently, it is exactly in the middle of the range. It's worth noting that moving to a new proof-of-stake (PoS) mechanism didn't add power to the second largest coin so far.          

The combined market dominance is solid, hovering around 60%.

Let us move on to the rest of the top ten list excluding stable coins. Continue reading "Crypto Update: This Major Coin Could Bounce"

Crude Oil vs Platinum: You Bet Right

It is just amazing how many times you guess not only the direction but also the peaks and troughs of the prices of different instruments. This is crowd-thinking or crowd-analyzing, when the winning ideas are crystallized into the major wager.

This “market distortion” was spotted in July and it was updated this September. Almost all of you were betting that crude oil and platinum would meet on the price chart again. So, here it is in the chart below.

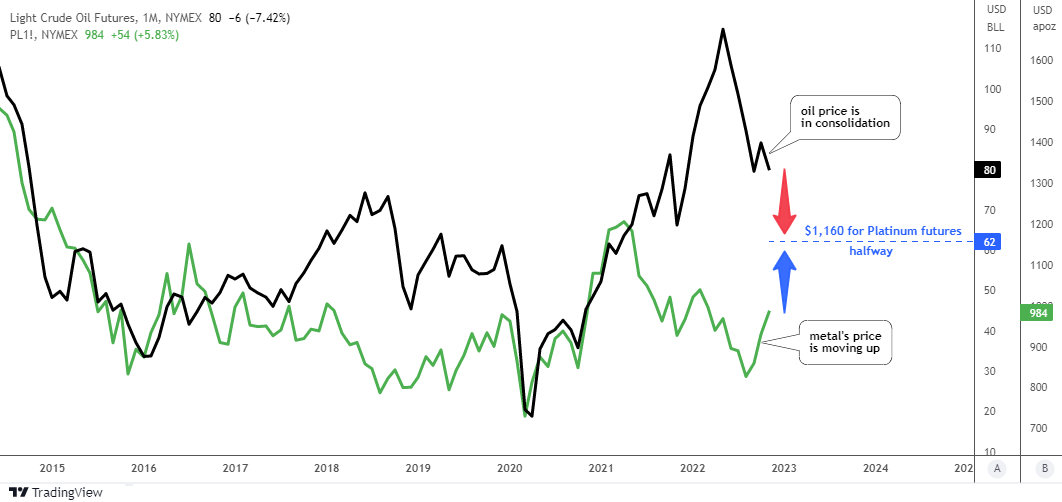
Crude Oil VS Platinum

Source: TradingView

The magic of your major bet is right here in the making. As the oil price remains stuck in a sideways consolidation, the platinum price is taking quick steps towards "black gold".   

In September, crude oil futures completed their mission as the initial meeting point was set at $75 and the valley was at $76. Hence, the consolidation that followed gave the metal a chance to catch up.

The updated meeting point has been recalculated to be set at $62 for crude oil futures and at $1,160 for platinum futures. This could happen in an ideal situation. Historically, however, one of the instruments has often lagged behind.

Last time I updated the platinum futures chart for you and it played out well according to the bullish option.

Let me update the oil futures chart this time as it has changed a lot. Continue reading "Crude Oil vs Platinum: You Bet Right"

These Stocks Are Falling Knives

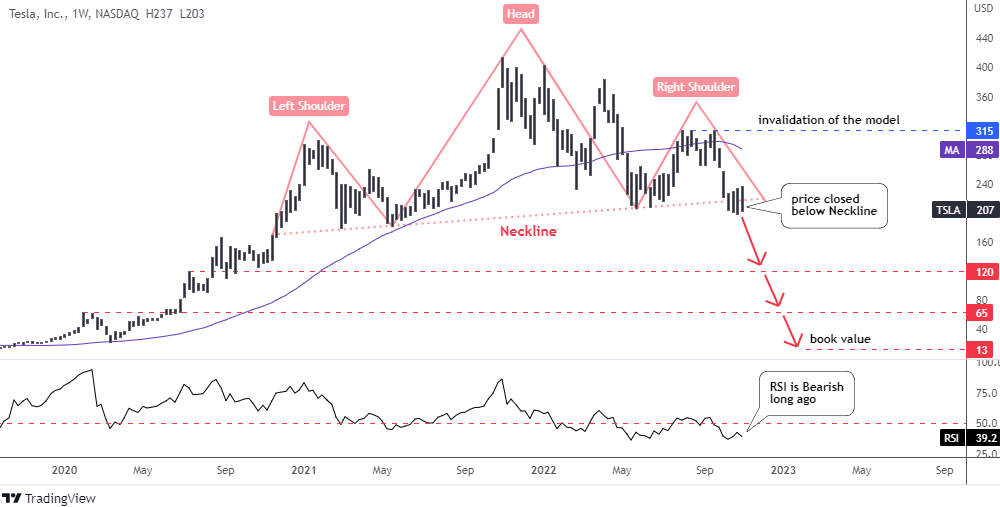
It is good to see a Head and Shoulders pattern in the making and to see it in the final stage is great luck. Fortunately, I spotted one such pattern in the chart of the Tesla (NASDAQ:TSLA)TSLA Weekly Chart

Source: TradingView

The stock price of Tesla has been trading in a big range between $180 and $414 after it managed to break above the Y2020 top of $167. Peak points were distributed unevenly as we can see the lower tops on both sides of the all-time high. This has shaped a notorious Head and Shoulders pattern on the weekly chart.

We saw this model in the Ethereum and AMD charts this year.

The model is clear; it has slightly up-sloping angle as the Right Shoulder is located higher than the Left Shoulder. A Neckline has been built through the valleys of the Head. The stock price has been hovering here for some time.

Last week, the market closed below the Neckline triggering the bearish signal.

The target of this pattern is located in the negative numbers area so I skipped it. Instead, I highlighted three potential supports that could stop the upcoming collapse.

The first support is located at the peak of August 2020 at $120. It was broken to the upside and then it was retested by a huge consolidation.

The next support comes from the top of February 2020 at $65. The price has been struggling to overcome it for a long time. The book value level of $13 is the ultimate support based on fundamental data. Continue reading "These Stocks Are Falling Knives"