Citibank Fails The Fed Stress Test - See If You Can Spot Why

Hello investors, traders and MarketClub members everywhere! Adam Hewison here, President of INO.com and co-creator of MarketClub, with a look at Citigroup, Inc. (NYSE:C) on Thursday, the 27th of March.

News came out yesterday that the Fed had "stress tested" 30 banks and that 5 of the 30 had failed to pass. While some of the banks were expected to fail and came as no surprise, what was a surprise to the market was the failure of Citigroup, Inc. (NYSE:C).

In the Trade Triangle column of the image below, do you notice anything different about any one particular bank?

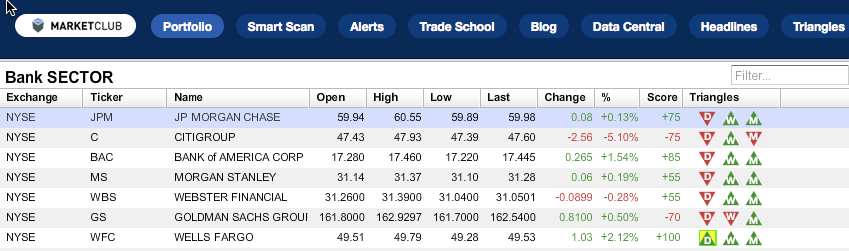
As you can clearly see, Citigroup (NYSE:C) has a red monthly Trade Triangle next to its name. That red monthly Trade Triangle kicked in on January 31st and served as a warning to MarketClub members that all was not well at Citigroup. Continue reading "Citibank Fails The Fed Stress Test - See If You Can Spot Why"

Apple Is Trending Higher While Amazon Is Trending Lower, Why?

Yesterday, the Trade Triangle technology flashed two important signals for two major stocks.

Apple (NASDAQ:AAPL) triggered a new green weekly Trade Triangle, signaling that the upward trend was resuming. This signal pushed all of Apple’s Trade Triangles into the green column, indicating that higher prices could be ahead for this stock.

Amazon (NASDAQ:AMZN) triggered a new red weekly Trade Triangle, indicating prices should be going lower. This signal pushed all of Amazon’s Trade Triangles into the red column, suggesting downside pressure is ahead for this stock.

Apple (NASDAQ:AAPL) - Major Trend Bullish

New Green Weekly Trade Triangle on 3/24/14 at $539.66

Apple, who has enjoyed remarkable "rock star status" in the past, has really fallen into a sort of pedestrian-type mentality and doesn't seem to have the cachet that it once enjoyed. However, the chart formation that Apple is coming out of indicates the potential for another big move up to the $700 a share level. Perhaps this has to do with the potential partnership with Comcast or some new technology that we have yet to see.

I like the overall chart pattern on Apple and the continuation Trade Triangle breakout to the upside. I also like the fact that the major support, which was the previous high seen in September of last year, also represented a major Fibonacci support zone for this stock. My analysis on Apple would change should it move below the $520 level and major support at $500.

Amazon (NASDAQ:AMZN) - Major Trend Bearish

New Red Weekly Trade Triangle on 3/24/14 at $354.48

Continue reading "Apple Is Trending Higher While Amazon Is Trending Lower, Why?"

In-Depth Analysis: Halliburton Company (NYSE:HAL)

Today, I am going to be analyzing the stock of Halliburton Company (NYSE:HAL). On January 27th, a new red monthly Trade Triangle appeared, the first in 12 months for the stock. This indicates a significant technical development and changes the outlook and direction of Halliburton.

Today's in-depth analysis is not to say the stock is going to collapse and go out of business, but rather I am noting a confluence of certain technical indicators that do not paint a positive picture for this stock.

There is an old adage in trading and it says "they slide faster than they glide." Translated that means stocks go down a lot faster than they go up.

What Does This Company Do?

Halliburton Company provides a range of services and products for the exploration, development, and production of oil and natural gas to oil and gas companies worldwide.

Chart Legend & Technical Picture (Black Numbers)

Continue reading "In-Depth Analysis: Halliburton Company (NYSE:HAL)"

Chart to Watch - S&P 500 Futures

We've asked our friend Jim Robinson of profittrading.com to provide his expert analysis of charts to our readers. Each week he'll be analyzing a different chart using the Trade Triangles and his experience.

Today he is going to take a look at the technical picture of the S&P 500 Futures Contract (CME:SP.H14.E).

This week let's take a look at the S&P 500 futures contract.

When trading futures with the Trade Triangles you use the weekly Trade Triangles to tell trend and the daily Trade Triangles to time the entry and exits.

The weekly Trade Triangle turned red Trade on 1/13/14 and a red daily Trade Triangle on 1/21/14 which would have put any one trading the E-mini S&P 500 with the MarketClub system short just before Friday's 1/24/14 big down day and break of support. Continue reading "Chart to Watch - S&P 500 Futures"

Best Buy (NYSE:BBY) Implodes

Best Buy Co., Inc. (NYSE:BBY) was one of the top performing stocks in 2013. Best Buy (NYSE:BBY) reported on Thursday that total revenue and sales at its established US stores fell in the all-important holiday season due to intense discounting by rivals, supply problems for key products and generally weaker traffic in December. After starting out the trading year of 2013 at $12, this stock performed like the energizer bunny and kept going and going and going for most of the year. It hit a high of $44.60 on November 13th, a month before the all-important holiday season reality set in.

What Does This Company Do?

Best Buy Co., Inc.(NYSE:BBY) operates as an e-commerce and physical retailer of consumer electronics in the United States, Europe, Canada, and China.

Was Best Buy's Implosion Predictable?

No one can predict with 100% certainty what's going to happen in any given market. What technical analysis can do, and does do very well, is put the odds in your favor and give you a high degree of confidence that something is going to happen. It also acts to protect your capital when things go wrong in a market. That is done through the use of money management and discipline, both of which I talk about frequently on this blog. Let me illustrate for you how two simple technical tools would have helped you avoid today's disaster in Best Buy. Continue reading "Best Buy (NYSE:BBY) Implodes"