
The market moves in zigzags and not in a straight line as it takes a break from time to time to accumulate enough power to continue with the trend. In my post last week, I mentioned the US dollar index (DXY) as one of the drivers of the precious metals rally. This time I would like to share the daily chart of it below as I spotted a reversal signal there, which could affect precious metals.
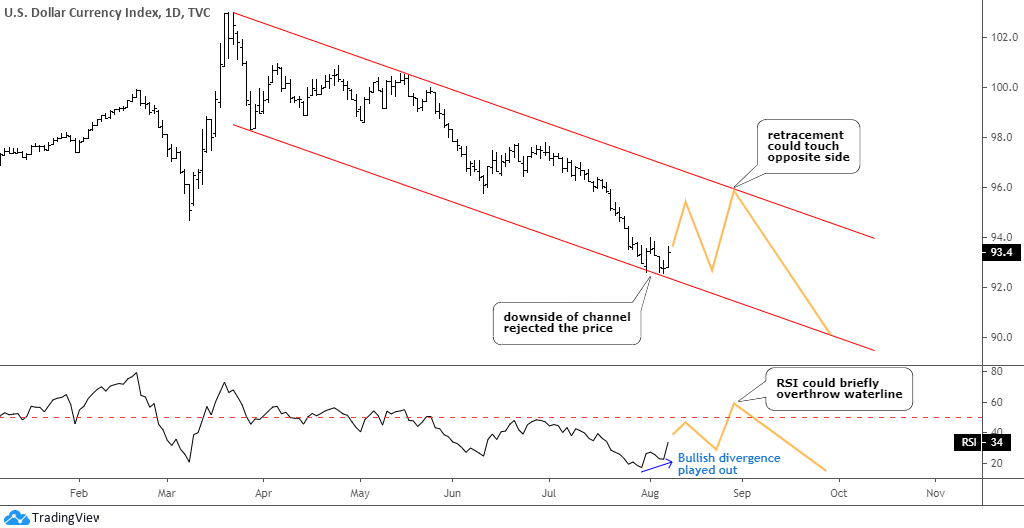
The DXY price was rejected right at the contact point with the downside of the red downtrend channel. The price tried that support twice on the 31st of July and the 6th of August but failed to break below. This, again and again, demonstrates the power of simple trend channels.
The other move was very sharp to the downside within two equal zigzags pushing the price from 100.9 to 92.5. The DXY was oversold, and now it could enter the retracement stage to let traders book some profit covering shorts, and contrarian traders might enter longs here playing on the trendline rejection. The price could touch the opposite side of the trend channel around 96 as this could be not a minor, but a large corrective structure as we saw such last time only this April.
In the background, the RSI also showed a Bullish divergence with higher valleys, and it finally plays out now as the price is moving north. The indicator could briefly overthrow the “waterline” of 50 during the expected correction.
This could spur a mirrored long covering within a consolidation in precious metals. Let’s see the updated gold & silver charts below.
The daily gold chart is next.
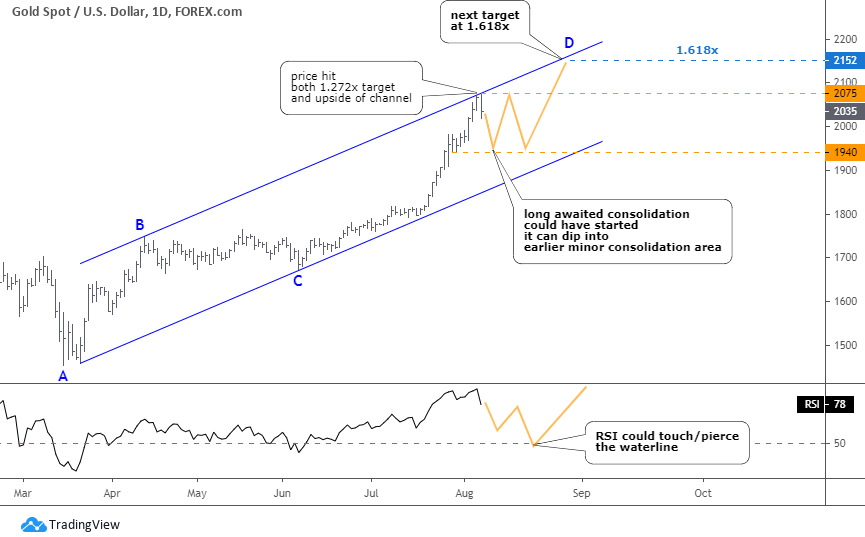
What was thought to be a start of a deeper correction turned out to be just a minor consolidation in gold as the price finally hit both the opposite side of the blue uptrend channel and the 1.272x target ($2050). Another all-time high was hit at $2075 last Friday. Most of you bet that the price will retrace as I did. The second bet with a minor gap was a non-stop growth, and it was the right choice.
We can see the same situation here as we observed on the DXY chart – the price has hit the trendline of the channel and was rejected. The long-awaited consolidation could have started here also.
I added the orange zigzag here to show the possible path. This correction could emerge within some complex structure like a triangle. I showed the simple two-legs zigzag down, which could retest the valley of the previous minor consolidation at $1940. When we see the first leg down, we can project the possible size of another leg down, so let’s wait.
We don’t have a Bearish divergence on the RSI sub-chart, but the overall overbought situation is in place. The consolidation could bring the indicator down to the crucial 50 level and even pierce it for a while. This will relax it and open the room for another rally.
The next target is at a classic 1.618x distance of the AB segment at $2152. It is located on the upside of the uptrend channel.
The daily silver chart follows.
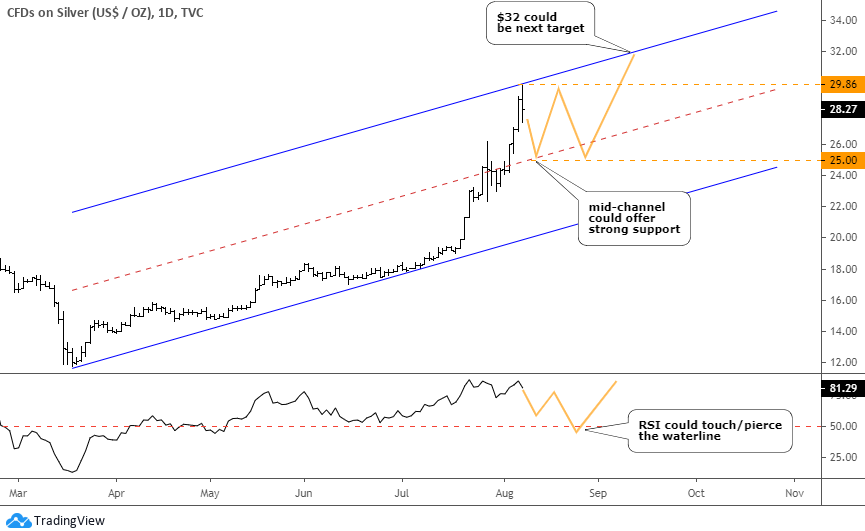
I saw different dynamics of the silver price in the last two posts as structure, and the overall position of the price is not similar to the gold. Last time, I was bullish as RSI offered some more room compared to gold, and I saw the price to retest the former top and even reach the upside of an uptrend at $27 and so did the majority of readers who bet on it. Indeed, the price retested the former top and hit the upside of the channel, although it didn’t stop there and hit a fresh 7-year maximum of $29.86. We never know the top and the bottom ahead.
This time I think both metals could be in synch with a US dollar index, and the consolidation phase could have started here also. The price has already lost more than 8% from the top just the same day it hit the new high as the silver price was rejected from the round number of a new ten of $30.
You know how wild silver’s price dynamics are, and its correction could be sharper, though. I put the orange zigzag on the chart as a possible path for the price. The mid-channel could offer strong support at $25 level. The structure could be tricky, so the first leg of consolidation could give us a clue of the possible entire model upon completion.
The RSI could reach and even pierce the 50 level as we saw it this April.
Intelligent trades!
Aibek Burabayev
INO.com Contributor, Metals
Disclosure: This contributor has no positions in any stocks mentioned in this article. This article is the opinion of the contributor themselves. The above is a matter of opinion provided for general information purposes only and is not intended as investment advice. This contributor is not receiving compensation (other than from INO.com) for their opinion.
platinum and palladium now after silver more recently and gold before that
Dear David, thank you for sharing. Be careful with PGMs. Good luck, Aibek
Dear Ed, it was a sniper shot indeed! Thank you for sharing, let's see which one will win. Best regards, Aibek
Silver *was* my favorite. I cashed out near the top, the night it hit a high of $29.915. My choice now is gold and platinum.
seems unsteady