
The king currency and the precious metals move amazingly in line with the previous forecasts. As time goes by, we can see the path clearer these days, and therefore I kept only the one option for each instrument to emerge.
Let us start this post with the updated daily chart of the U.S. dollar index (DXY), aka "King," as it keeps a strong influence on the precious metals.
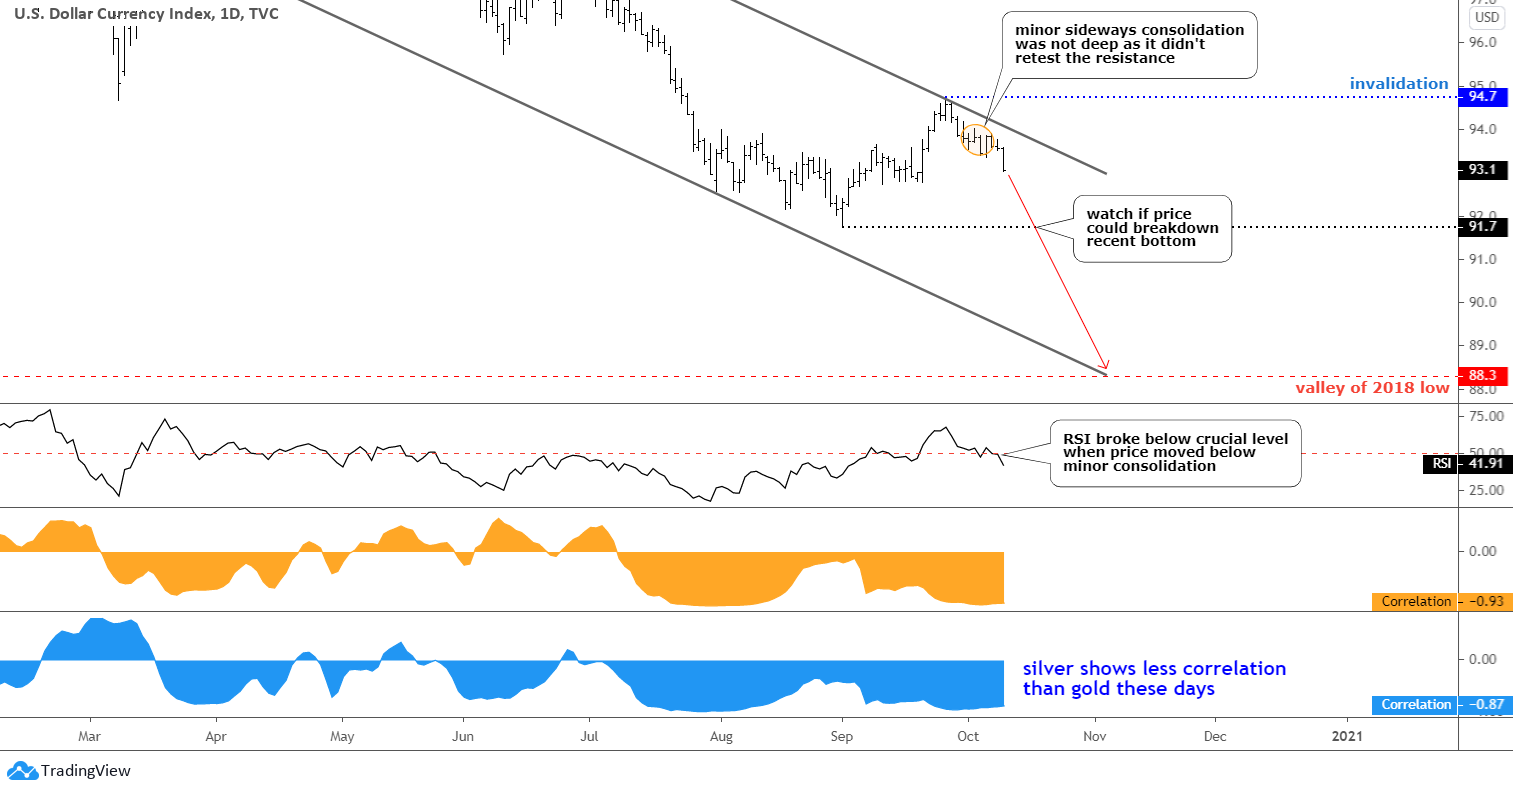
The selling pressure remains relatively strong in the dollar index. The expected pullback transformed into a minor sideways consolidation. It was not deep, as it could not retest the resistance. The price already broke below the consolidation valley in 93.3, and the RSI indicator confirmed that move down sinking below the crucial 50 level. This was one reason to think that we should now expect only the bullish option in the precious metals.
The next support is located at the recent bottom of 91.7. There we will see if it could break it or not. Only in case, it fails, there we should adjust the precious metals map.
I added correlation sub-charts for both gold and silver underneath. The gold (orange) still shows a strong negative correlation with a reading of minus 0.93 while silver demonstrates a fading but still strongly negative correlation these days with minus 0.87 reading. It was the opposite situation 2 weeks ago. I think the side of the market mattered. The bullish correction in the DXY was not fully translated to the gold market, as large players did not follow that pattern supporting the gold price while the silver price not.
The updated gold daily chart follows.

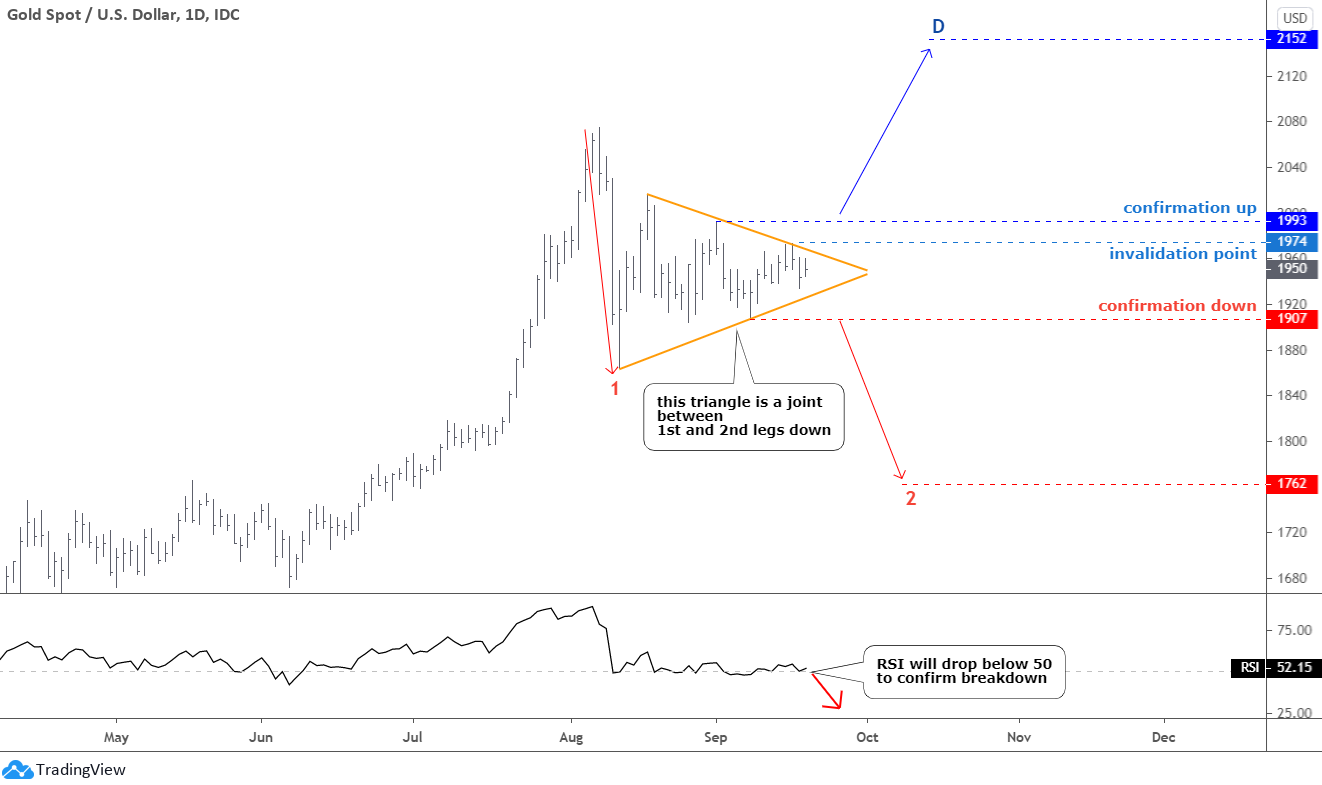
As I said at the opening of this post, I kept only one way to the precious metals' upside. This is the adjusted map, which was initially posted at the end of last month with a prophetic warning title "Too Good To Be True?". The first reason for changing back to more simple double-leg correction with a triangular consolidation in between is a very weak dollar these days.
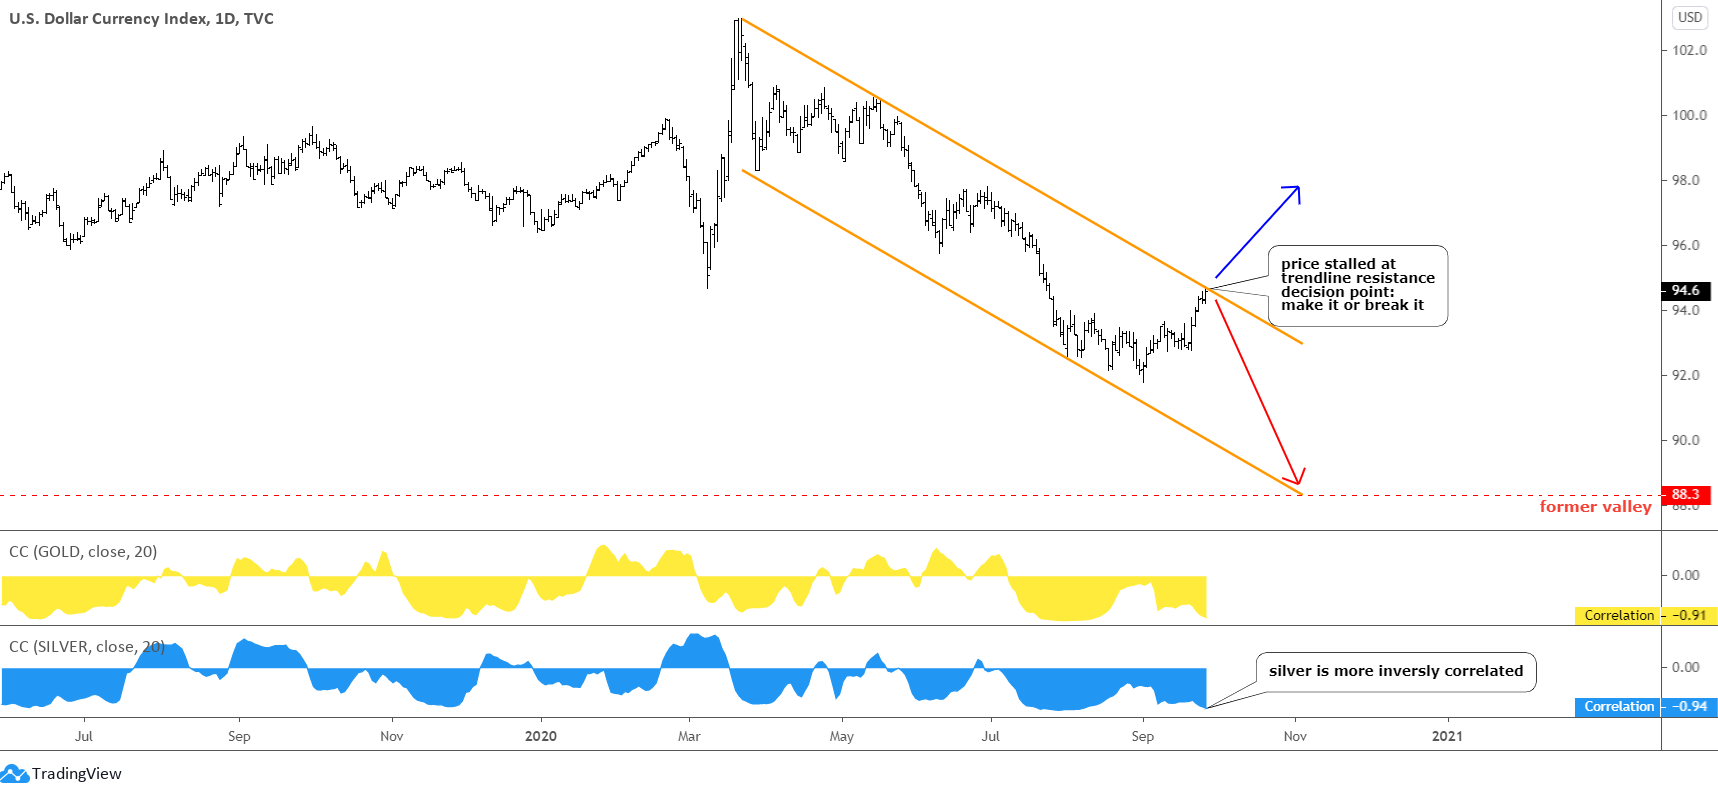
The other reason I revealed when I applied the powerful, seasoned tool of trend channels. Consolidations usually fit within trend channels; let it be a horizontal flat channel or a declining model. The latter was built through two peaks and one valley of the current consolidation. I also added the mid-channel (red dashed). As you can see in the chart above, the second leg bounced right off that added support. The price quickly moved to the upside until it reached the orange trendline resistance, where it was rejected. Again, we can see how powerful the channels are.
Gold has made a two-leg minor consolidation (orange ellipse) as I projected it in the previous post. It was a buying opportunity as the price did not trigger the invalidation point at $1848 and broke above both the consolidation and the orange trendline resistance. That breakup was confirmed with the RSI moving above the crucial 50 level.
The target remains the same at $2152, and we should watch the dollar index closely when it reaches the 91.7 confirmation point. The price action there will give us further clues if we should get back to a more complex correction plan or not.
The updated silver daily chart below is the last.
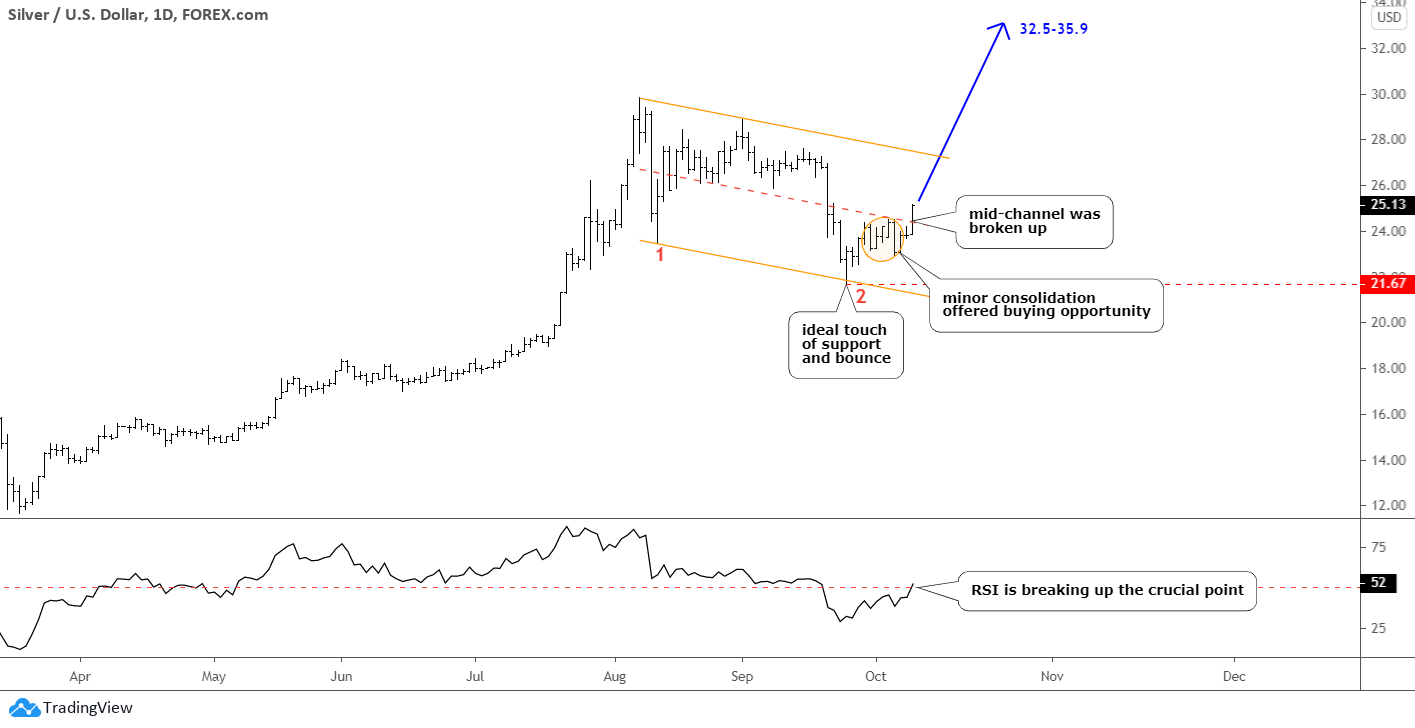
I applied the trend channel to the silver chart to contour the consolidation, and we can see there that it looks just perfect as the second leg touched right the bottom of the orange channel. Then the price reversed sharply to reach the mid-channel (red dashed) before entering the minor consolidation. It was less sharp here than on the gold chart as silver's price finished the second leg down in the first leg's valley just around the $23 level.
At the end of the last week, the price broke above the mid-channel, and the RSI indicator, at the same time, penetrating the crucial level to the upside. The next resistance would be at the trend channel's upside of $27.4.
The target is still the same in the area between $32.5 and $35.9. We should watch DXY forecast silver's price as well when it reaches 91.7 for further clues.
Intelligent trades!
Aibek Burabayev
INO.com Contributor, Metals
Disclosure: This contributor has no positions in any stocks mentioned in this article. This article is the opinion of the contributor themselves. The above is a matter of opinion provided for general information purposes only and is not intended as investment advice. This contributor is not receiving compensation (other than from INO.com) for their opinion.
Aibek - regarding gold, what do you think about a large cup and handle formation, with the cup starting way back in the fall of 2011 and finishing in August 2020? The handle then starting to form, which could take the next 2 years or so to complete? Thanks!
Dear Bob C, your finding could, indeed, emerge as the famous cup & handle pattern. It looks like cup has already been built as per time period that you have kindly provided. But the tricky part is that we should wait for a handle to shape to acknowledge the pattern. If it will take place then it could take some time, probably one or two years as you have mentioned. As per my view, there is another move to the upside is pending before we will roll in possible large consolidation, which could build a handle part. But if this expected move to the upside will be too strong then it would invalidate the cup and it will be visible, so you can avoid misinterpretation. Stay tuned as I update charts regularly for you.
Best wishes, Aibek
Great charts. Thanks.
Dear Mr.Macrory, thank you for a warm feedback!