U.S. Stock Market Rolls Lower

Stock market price action is usually conducted in a series of up and down price phases – or waves/cycles. Typically, price will move higher or lower in phases- attempting to trend upward or downward over time. This type of price action is normal. Extended upward trends with very little downward price retracements happen sometimes – but not often. They usually happen in “excess phase” rallies or after some type of news event changes expectations for a symbol/sector.

Putting Concerns Into Perspective – Still Bullish

Since early November 2020, the US stock market has continued to rally in a mode that is similar to an excess phase rally – showing very little signs of moderate price rotation. While price volatility has continued to stay higher than normal, you can see from the SPY Daily chart below that it has rallied from $324.40 to $385.95 (over 18%) in just under 90 days. At some point in the future, a moderate price rotation/retracement will happen that may be in excess of 6% to 11% – as has happened in the past.

Stock Market

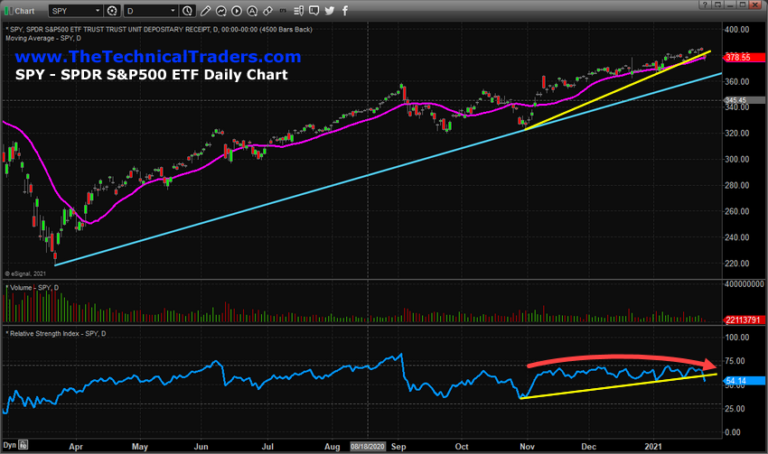
The purpose of this research post is to alert readers that the markets appear to have started a period of downside price rotation – which is normal. This SPY Daily chart, above, highlights the upward support channel originating from the March 21, 2020, COVID-19 lows (CYAN line) and also the upward support channel originating from the early November 2020 lows (YELLOW line). Continue reading "U.S. Stock Market Rolls Lower"

World Oil Supply And Price Outlook, January 2021

The Energy Information Administration released its Short-Term Energy Outlook for January, and it shows that OECD oil inventories likely bottomed in this cycle in June 2018 at 2.802 billion barrels. Stocks peaked at 3.210 billion in July 2020. In December 2020, it estimated stocks dropped by 40 million barrels to end at 3.061 billion, 172 million barrels higher than a year ago.

The EIA estimated global oil production at 93.45 million barrels per day (mmbd) for November, compared to global oil consumption of 95.59 mmbd. That implies an undersupply of 2.14 mmbd or 64 million barrels for the month. About 30 million barrels of the draw for November is attributable to non-OECD stocks.

For 2020, OECD inventories are now projected to build by net 127 million barrels to 3.006 billion. For 2021 it forecasts that stocks will draw by 95 million barrels to end the year at 2.910 billion.

Oil

The EIA forecast was made incorporates the OPEC+ decision to cut production and exports. According to OPEC’s press release on January 5, 2021: Continue reading "World Oil Supply And Price Outlook, January 2021"

Why You Should Prepare For A Jump In Volatility

By Elliott Wave International

Stock market volatility is like a roller-coaster ride -- extreme ups and downs.

However, unlike thrill-seeking roller-coaster riders who often rise from their seats after the ride with a smile, investors often exit with a frown.

That's because extreme volatility after a stock rally often ends with prices much lower.

Having said that, many investors -- even professionals -- do not anticipate a jump in volatility right now.

Indeed, the San Diego Union-Tribune asked the senior principal of a financial advisory firm on Jan. 15:

Will 2021 be a volatile year for the stock market?

He replied:

Continue reading "Why You Should Prepare For A Jump In Volatility"

S&P 500, Dollar Index, Gold, And Silver Updates

Before I start this update about the dollar, gold and silver, I would like to show you how accurate your prediction was for the S&P 500 back in October of 2020! At the time, I demonstrated to you the well-known Cup & Handle pattern in the making. That model was promising as the target was set at an ambitious $3891 level. Let us see it again below to refresh the memory.

S&P 500, Dollar Index, Gold, And Silver Updates

When I asked your opinion, whether this pattern is valid and will play out, most of you replied positively and supported my target. Let us see in the updated chart below how it played out.

S&P 500, Dollar Index, Gold, And Silver Updates

Your "crystal ball" worked perfectly as the new record maximum established last Thursday at $3860 had been just $31 below the target. The price action was not straight to the target as after the post, the price dropped quite deep, and the whole model was close to invalidation. Luckily, the further reversal built the "no look back" upside move. Continue reading "S&P 500, Dollar Index, Gold, And Silver Updates"

Will The Futures Market Heat Up?

Natural Gas Futures

Natural gas futures in the March contract are currently trading at 2.44 after settling last Friday at 2.69 continuing its bearish momentum. Forecasts for warmer U.S. weather will curb heating demand for nat-gas continue to weigh on nat-gas prices.

On Thursday, the Weather Commodity Group said that the U.S. South and Midwest should see higher-than-normal temperatures predominantly over the next 2 weeks and that prior forecasts for a polar vortex in the Arctic to drop down into the U.S. later this month is not going to materialize. I'm not involved as I keep a close eye on a possible counter-trend trade. I think the spike bottom, which was created on December 28th around the 2.26 level, will hold as a possible Head Shoulders bottom pattern could be forming, in my opinion.

Natural gas prices are trading below their 20 and 100-day moving average as this trend remains lower to choppy. Still, I think this commodity will join the rest of the energy sector to the upside; it's just a matter of when the risk/reward will become more in your favor, especially if cheaper prices come about, so be patient and sit on the sidelines.

TREND: HIGHER
CHART STRUCTURE: POOR
VOLATILITY: HIGH

Copper Futures

Copper futures in the March contract is currently trading lower by 260 points at 3.6215 a pound after settling last Friday in New York at 3.6020, up about 200 points for the week still stuck in a tight 6-week consolidation pattern. Continue reading "Will The Futures Market Heat Up?"