Top Fiat vs Gold in 2022: Focus on Inflation

It is time for my traditional yearly post to find out which fiat could beat the conventional store of value this year.

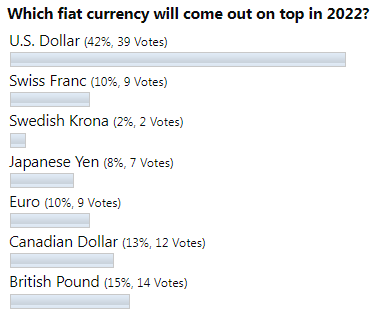
Let us see below how you predicted the future back at the end of December 2021.

Poll Results

The U.S. dollar was again the favorite bet for many of you. The next choice was the British pound, likely because it finished second in 2021. Among the top three bets, the Canadian dollar was an interesting choice that could be justified by the previous top ranking.

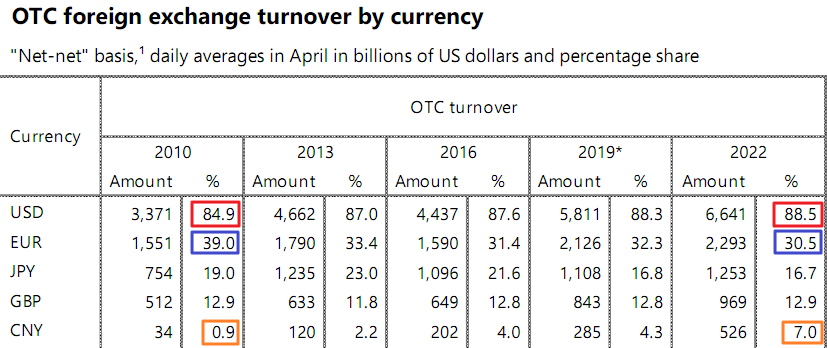
This time I changed the list of currencies to include only the top 5 currencies based on real foreign exchange turnover according to the Bank for International Settlements as per the table below.

OTC Foreign Exchange Turnover By Currency

Source: Bank for International Settlements

The following top 5 fiat currencies are listed in the table above: U.S. dollar (USD), euro (EUR), Japanese yen (JPY), British pound (GBP) and Chinese yuan (CNY). Continue reading "Top Fiat vs Gold in 2022: Focus on Inflation"

How Low Can Tesla Go?

2022 Year-to-date shares of Tesla (TSLA) are down 66%. The question everyone is wondering is, "Can Tesla fall more?" The simple answer is yes. Any stock, even one with a cult-like following, can go to zero.

The question we should be asking is, when is Tesla stock fairly valued? Or even better, undervalued? Having an idea of what price Tesla should be valued at will give investors a better idea of when they should buy or sell. And really, the only time you buy or sell should be when a stock is overvalued or undervalued.

The problem is that valuing a stock is not cut and dry. Nearly every investor will inevitably come up with a different value for a stock, even if they are using the same data to do their valuations.

With that in mind, let us look at one way of valuing Tesla and determine if it is over, under, or fairly valued.

Today we will be using a comparison method of valuing Tesla. We will look at what Tesla does, compare its business to other companies operating in the same industry or industries, and determine if Tesla is appropriately valued based on its competitors.

Tesla is more than just a car company. I know you have all heard that before. Tesla considers itself a car company and an energy generation and storage company. So let us first compare Tesla to other solar energy generation and storage companies, and then we will tackle the car company side of the business.

A few years ago, Tesla purchased Solar City. A solar panel company that installs solar panels on residential and commercial buildings and has add-on battery storage components.

We can compare this side of Tesla's business to First Solar (FSLR). First Solar makes, installs, and maintains solar panels just like Solar City does for Tesla. First Solar is valued at just under $16 billion and has a price-to-earnings ratio of 165.

However, Tesla and Solar City also sell backup batteries that can be installed in a home. These batteries would be used during power outages or when solar panels aren't generating power, such as at night.

A comparison company for this would be Generac Holding (GNRC), which also sells power backup products, mainly generators, but they have battery backup systems for solar panels. Generac currently trades for $6.5 billion and trades at a P/E of 15, much more reasonable than First Solar. Continue reading "How Low Can Tesla Go?"

MCD vs QSR: Which Is Healthier For Your Portfolio?

While the S&P-500 (SPY) and Nasdaq Composite (COMP) are on track for a significant losses this year, the Restaurant Sector has put together a solid performance, on track for just a 9% loss or an 1100 basis point outperformance vs. SPY.

This is despite starting off the year with a much worse performance, with the index briefly down 25% as of May, despite it trailing the S&P-500 and Nasdaq at the time.

The strong recovery in the sector can be attributed to the fact that inflation looks to have peaked, which is a huge benefit to restaurant margins.

Plus, valuations were already at their most attractive levels since March 2020 as of early 2022, with the index starting its bear market six months before the S&P 500 in July 2021.

Finally, while not all restaurant names are considered defensive, quite a few are lower-beta, pay attractive yields, and some benefit from a recessionary environment as they become trade-down beneficiaries.

In this update, we’ll look at two of the largest names in the sector and which looks like the better buy after this violent market-wide correction.

McDonald’s (MCD) and Burger King (QSR) have gone head to head for years from a competition standpoint regarding burger wars.

While McDonald’s has more than twice the number of restaurants globally and started out a decade earlier with Burger King being the copycat, there’s no clear consensus on the better restaurant operator among the two.

From strictly a same-store sales or wallet share standpoint in the United States, McDonald’s has been the undisputed leader, and Burger King has lagged over the past couple of years.

However, with similar prices, similar menus, and Burger King’s appearing to have more iconic fries while McDonald’s wins on burgers, it’s difficult to crown a leader.

That said, there are significant differences when it comes to investing in the brands, especially given that Burger King is just one piece of Restaurant Brands International’s portfolio, which also consists of Popeyes’s Louisiana Chicken, Tim Hortons, and the newly added Firehouse Subs.

In this article, we won’t try to answer the near-impossible question of which is the better burger chain, but we’ll highlight which stock looks healthier for one’s portfolio. Continue reading "MCD vs QSR: Which Is Healthier For Your Portfolio?"

My Latest "Prediction" For 2023

Back in March I posited the notion that the S&P 500 would need to fall to about 2,900 before all of the froth that the Federal Reserve had injected into the market through its various monetary stimulus programs dating back to the Great Recession had finally burned off.

On Christmas Eve the S&P closed at 3844, which would put it 19% below its all-time high of 4,766 on December 27, 2021, or about a year to the day.

In recent days some market prognosticators have been warning that the market is poised to fall another 20%, which would put the index at about 3,000, or slightly above my guesstimate.

So do I feel vindicated, if that is the right word? No, and I hope I’m wrong anyway.

First, my guess was not a prediction, just a quick back-of-the-envelope calculation based on my assumption that the Fed was responsible for about half of the stock market’s 600% gain between the March 2009 bottom of 683 and the time I made my comment.

So, if we cut that 600% gain in half, that would reduce the S&P’s gain to a still respectable 300%, or a little below 3,000.

Not an educated estimate, maybe, but I thought a reasonable guess—a worst case scenario, if you will.

Second, we don’t know if these bears will turn out to be right. I hope they’ll be wrong.

I now believe the Fed won’t have to drive the economy into the tank in order to get inflation down to where it wants it to be, probably in the 2.5% to 3% range.

Remember, about two years, in what was considered to be a major policy shift, the Fed said it was willing to let inflation “overshoot” its long-term target of 2% for a time, as it indeed it did.

Now it looks like inflation is dropping a lot faster than most people thought, and the Fed itself is now forecasting that inflation will fall to 3.1% next year before declining in 2024 to 2.5% and 2.1% in 2025, i.e., putting it at its long-term target. Continue reading "My Latest "Prediction" For 2023"

Golden Pattern For Silver, Not Gold

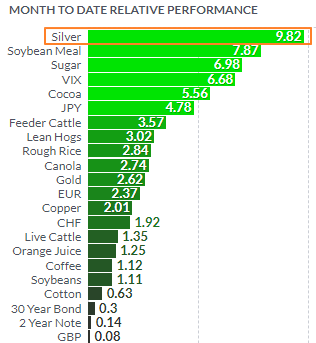
Silver futures continue to maintain leadership not only among metals, but compared to all futures as we can see in the leaderboard below.

MTD Relative Performance

Chart courtesy of finviz.com

The white metal has seen gains of close to ten percent month-to-date. None of the metals come close as copper futures, formerly the number two, has lost its shine lately as I shared the reason last week. When compared to silver futures, gold futures appear pale with gains of 2.62%.   

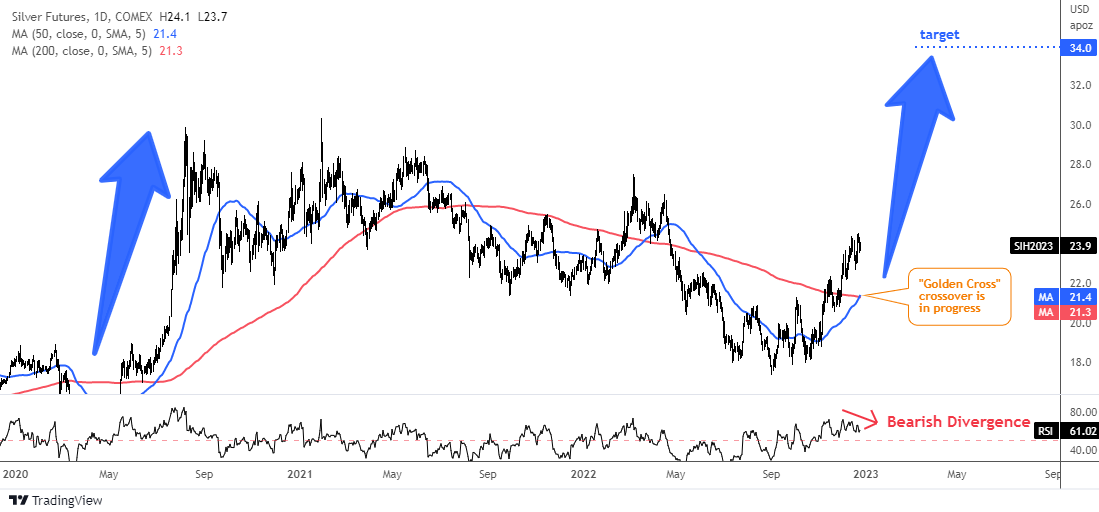
All last week, I observed a pattern in the making, watching to see when it would trigger. As a result, exactly at the end of last week, the expected event happened. Here is a visual representation in the daily chart below.

Silver Futures Daily Golden Cross

Source: TradingView

There are two simple moving averages in the silver daily chart above. The blue line represents a 50-day moving average and the red one is a 200-day moving average. We can see that last week the short-term blue line crossed above the long-term red line. This pattern is called a “Golden Cross”. It is a bullish sign as it indicates a change in the trend to the upside. Continue reading "Golden Pattern For Silver, Not Gold"