Reasons To Be Cheerful

According to the Federal Reserve, the economy is in danger of hurtling over another cliff. Still, recent economic statistics and market indicators paint a much more hopeful picture – the S&P 500 just hit a new all-time high, gold is falling, and bond yields are rising. Which story are we supposed to believe?

On the one hand, we have the recent economic statistics. On Friday, the Commerce Department reported that retail sales rose another 1.2% in July, pushing them above pre-pandemic levels. If that’s not a classic V-shaped recovery, I don’t know what is. While the headline sales figure came in below expectations of a 2.0% rise, the prior month’s 7.5% increase was revised upward to show an 8.4% jump. Excluding autos, July sales actually beat estimates, rising 1.9% versus a Street forecast of 1.5%.

Also, on Friday, the Fed itself reported that industrial production rose 3.0% last month, in line with estimates. In comparison, the capacity utilization rate rose more than two percentage points from the previous month to 70.6% and its fourth big monthly increase in a row.

The day before, the Labor Department said initial unemployment claims continued to drop, falling well below one million for the first time in several months and down sharply from a peak of near seven million in March, a reverse V-shaped drop.

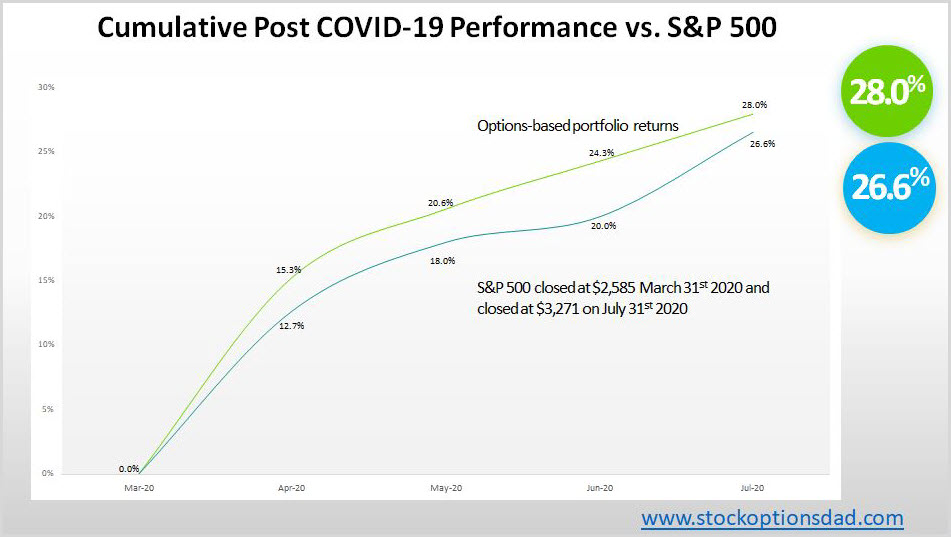
The financial markets seem to be buying it. Last week the yield on the benchmark 10-year Treasury note rose above 0.70% for the first time since late June, putting it up 20 basis points just in the previous 10 days. Gold is down more than 5% from its August 6 high. And of course, the S&P 500 has wiped out all of this year’s losses, including the 33% drop in February and March, when a good portion of the U.S. was going into lockdown. Continue reading "Reasons To Be Cheerful"

Tesla Is Going To Change The ETFs You May Own

Watching the Elon Musk and Tesla (TSLA) show from the sidelines has been both entertaining and exhilarating even for those investors who have never owned a single share of the electric vehicle company. But for many investors, the days of watching the historic run of Tesla’s stock price from the sidelines are likely soon to be over, regardless of whether or not you like it.

Tesla’s most recent quarterly earnings report was its fourth consecutive one in which the company posted positive earnings on a GAAP basis, which now makes the automaker eligible to join the S&P 500 index. So why does this matter to the average investor?

Well, first off, if you own any Exchange Traded Fund or Mutual Fund that tracks the S&P 500, you will now own Tesla indirectly if the company is added to the index. Furthermore, Tesla is a massive company. Its market capitalization is north of $250 billion, making it one of the biggest companies in the S&P 500 if it was already a part of the index. So, not only will Tesla be a part of your portfolio, but if you have a large position in an S&P 500 tracking index, well, you will now have a lot riding on Tesla living up to its lofty valuation.

Additionally, since it is not part of the index, and if it does get added, there will be massive selling of other index components to make room for Tesla. Let me explain this point in a little more detail, because its very, very important. The S&P 500, like many indexes, is a market capitalization-weighted index. This means that the largest company in the index, currently either Apple (AAPL) or Microsoft (MSFT), accounts for around 5.7% of the index. The smallest company in the S&P 500, represents less than 0.01% of the index. And remember, 500 companies comprise the index. Continue reading "Tesla Is Going To Change The ETFs You May Own"

Silver Futures Experience Volatile Week

Silver Futures

Silver futures in the September contract experienced one of the craziest trading weeks of all time as the volatility is extraordinarily high as prices traded as high as 29.91 before selling off to 23.58 having over a $6 trading range for the week as this commodity is not for the light-hearted.

I have been recommending a bullish position over the last month or so from the 18.61 level, and if you took that trade, continue to place the stop loss under the 2 week low standing at 23.58 as an exit strategy. However, the chart structure will not improve for another 8 trading sessions, so you will have to accept the monetary risk at this time. If you are not involved in this market, I would avoid it like the plague as the risk/reward is not in your favor, as I still think higher prices are ahead. Still, there is a high probability that we could consolidate the recent run-up in price over the next couple of weeks.

At the same time, I also have a bullish platinum trade, which continues to move higher weekly as the U.S. dollar is at a 2 year low. That is a fundamental bullish factor coupled with the fact that the Coronavirus situation doesn't seem to end anytime soon, so stay long.

TREND: HIGHER
CHART STRUCTURE: IMPROVING
VOLATILITY: HIGH

Platinum Futures

Platinum futures in the October contract settled last Friday at 970 an ounce while currently trading at 974 in a crazy volatile trading week as prices cracked the 1,000 level once again before profit-taking came about.

I have been recommending a bullish position over the last month or so from around the 868 level. If you took the trade, continue to place the stop loss on a closing basis only at 930 as an exit strategy. However, the chart structure will not improve for quite some time, so you will have to accept the monetary risk. Platinum prices are still Continue reading "Silver Futures Experience Volatile Week"

Options Trading - S&P Outperformance Despite Epic Bull Run

A total of 80 options trades were placed in May, June, July, and thus far in August as the markets rebounded after the COVID-19 lows. During this timeframe, all 80 trades were winning trades to lock in a 100% option win rate with an average income per trade of $189 and an average return on investment (ROI) per trade of 7.5%. After the tumultuous market lows of March and into early April, leveraging a minimal amount of capital, mitigating risk, and maximizing returns was essential. An options-based portfolio can offer the optimal balance between risk and reward while providing a margin of downside protection with high probability win rates. As the market continues to rebound, optimal risk management is essential when engaging in options trading as a means to drive portfolio performance.

Through the end of July, an option-based portfolio broken out into roughly three equal parts of cash, long equity and options outperformed the S&P 500 by a comfortable margin, posting returns of 28.0% and 26.6%, respectively. When engaging in options trading, risk mitigation needs to be built into each trade via risk-defining trades, staggering options expiration dates, trading across a wide array of uncorrelated tickers, maximizing the number of trades, appropriate position allocation, and selling options to collect premium income. Maintaining disciple via continuing to risk-define trades, leveraging small amounts of capital while maximizing return on investment, is essential despite the impressive streak of 80 consecutive winning trades.

Anchoring Down An Options-Based Portfolio

Anchoring down an options-based portfolio is a key component to taking advantage of black swan events such as COVID-19 via broad-based ETF exposure. During the market lows of March/April, the cash-on-hand component of an options-based portfolio was used to go long equity via Dow Jones (DIA), S&P 500 (SPY), and Nasdaq (QQQ). The cash-on-hand was repurposed to balance out the portfolio into roughly three equal parts of one-third cash, one-third long ETF-based equity, and one-third options driven. Through the end of July, an option-based portfolio broken out into roughly three equal parts of cash, long equity and options outperformed the S&P 500 by a comfortable margin, posting returns of 28.0% and 26.6%, respectively (Figure 1).

Options

Figure 1 – Overall options-based portfolio returns compared to the S&P 500 returns over the previous four months post COVID-19 lows of 28.0% and 26.6%, respectively

4 Months Post COVID-19 Results

After placing 80 trades throughout May, June, July, and thus far in August, a 100% options win rate, 99% premium capture, and 7.5% ROI per trade was achieved. This was accomplished via leveraging a minimal amount of Continue reading "Options Trading - S&P Outperformance Despite Epic Bull Run"

World Oil Supply And Price Outlook, August 2020

The Energy Information Administration released its Short-Term Energy Outlook for August, and it shows that OECD oil inventories likely bottomed in this cycle in June 2018 at 2.804 billion barrels. It estimated stocks dropped by 58 million barrels in July to end at 3.113 billion, 172 million barrels higher than a year ago. It estimates that inventories peaked in May 2020 at 3.181 billion.

The EIA estimated global oil production at 88.72 million barrels per day (mmbd) for July, compared to global oil consumption of 93.42 mmbd. That implies an undersupply of 4.69 mmbd or 146 million barrels for the month. About 88 million barrels of the draw for July is attributable to non-OECD stocks.

For 2020, OECD inventories are now projected to draw by a net 34 million barrels to 2.859 billion. For 2021 it forecasts that stocks will draw by 102 million barrels to end the year at 2.757 billion.

Oil

The EIA forecast was made to incorporate the OPEC+ decision to cut production and exports. According to OPEC’s press release: Continue reading "World Oil Supply And Price Outlook, August 2020"