Is Inflation Truly Whipped?

Last week’s consumer price index report showing inflation — at least by some measures — had slowed in October to its lowest level since the beginning of the year set off a massive rally in stocks and bonds.

But is the market overreacting, and does the report necessarily imply that inflation has finally and truly peaked and that the Federal Reserve is just about done tightening? It may be a little too early to declare victory.

The report was at least encouraging, certainly, but whether we’re home free or not remains to be seen. The headline CPI rose 7.7% compared to a year earlier, down from September’s 8.2% pace and the smallest year-on-year increase since January.

The core index — which excludes food and energy prices — rose by 6.3%, down from the prior month’s 6.6% pace. But the monthly increase in headline inflation was 0.4%, unchanged from September.

Did all that justify a 5% jump in the NASDAQ last Thursday and the sharpest one-day drop in bond yields in more than 10 years, with the yield on the benchmark 10-year Treasury note falling to 3.83% from 4.15%? (The bond market was closed Friday for Veterans Day.)

If you believe Wharton professor Jeremy Siegel, who has been saying for months that the Fed is seriously overcounting inflation, then last Thursday’s massive rally was justified.

Not only did he tell CNBC that "inflation is basically over,” but that "we're in negative inflation mode if the Fed uses the right statistics, not the faulty statistics that they've been using."

Siegel specifically cited the cost of housing and rent, which he says are overinflated in the data the Fed uses to set interest rate policy. Once the Fed sees the light, he says, the markets are poised for a “good year-end rally," but if it doesn’t, we could be headed for a rate-driven recession.

There’s certainly reason to doubt the Fed’s competence to measure and assess home price inflation, which it has failed to accomplish the past several years and other times before that.

Despite blatant evidence that the housing market was overheating during and after the pandemic, the Fed continued to suppress interest rates, allowing home prices to skyrocket — and keep homeownership out of reach for more people. Continue reading "Is Inflation Truly Whipped?"

Can Central Banks See What We Don't?

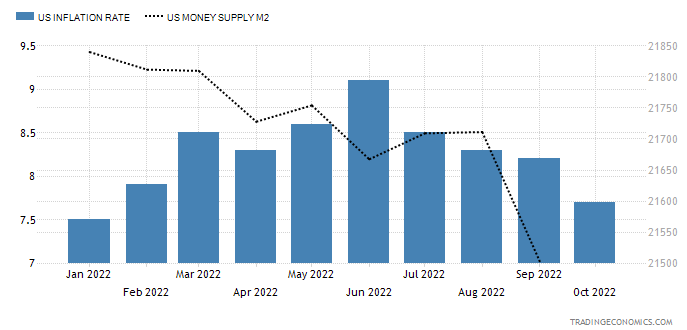
The gold futures have skyrocketed on better than expected U.S. inflation data last week. The annual inflation rate in the U.S. slowed for a fourth month to 7.7% in October, the lowest reading since the start of a year, and well below forecasts of 8%.

US Annual Inflation & M2

Source: TRADING ECONOMICS

According to logic, the gold price should fall as anti-inflationary tightening measures have shown positive results in cooling price growth. The printing press, represented by the M2 money supply indicator (black dotted) in the chart above, has stopped and the reading is declining as well.

Let us check the chart below to look for an answer in the fundamental data of world gold demand.

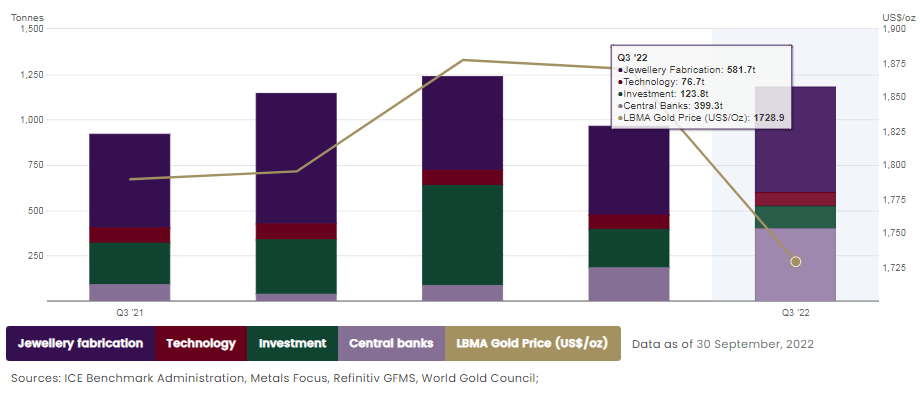
WGC Gold Demand

Courtesy of World Gold Council

The graph above shows the quarterly data of demand statistics in the period from Q3 2021 to Q3 2022. According to the data, the most stable demand source comes from a technology side (wine-colored). The jewelry demand (dark purple) is price sensitive: it shrinks on the rising price and expands during price falls. The investment demand (dark green) is cooling down amid the tightening as per the logic I explained above. Continue reading "Can Central Banks See What We Don't?"

Is The Bitcoin Crash Over?

The cryptocurrency Bitcoin hit its most recent all-time high just over a year ago, on November 10th, 2021, at $69,000 per coin. More recently, Bitcoin was trading in the $16,000 range, that's more than a 76% decline.

Long-term Bitcoin bulls will be quick to point out that since its inception, Bitcoin has experienced other declines that fall within the same percentage drops. However, knowing that type of move has happened in the past, and the cryptocurrency rallied back probably doesn't help those who bought Bitcoin up at the highs feel much better about their investment.

But what about if you have been sitting on the sideline, waiting for the right time to buy Bitcoin? Is today a good time to buy the cryptocurrency?

For all the bulls out there, I already know I have been wrong about Bitcoin in the past, and I am wrong again this time. But hear me out before you write me off. I believe there are a few reasons why we have not seen the bottom of the current Bitcoin crash.

First and foremost, we are heading straight toward a recession. You may not want to believe it or face reality. Still, it is coming.

Just last week, Federal Reserve Chairman Jerome Powell told investors that the likelihood of a soft landing was rapidly diminishing. Inflation is still high, and Fed Members have made it clear that bringing down inflation is the most important problem to tackle now. And despite interest rates at levels we have not seen in a decade, the Fed believes we will still need more increases in the coming months.

The coming recession is important for Bitcoin's price because up until this point, Bitcoin has not proven to be a "safe haven" asset.

Furthermore, even gold, an investment that most investors would consider pumping money into during uncertain economic times, has not been rallying during this market downturn.

Many investors point to the fact that the dollar has strengthened as one reason why gold and cryptocurrencies are down. A strong dollar could be due to Treasury bonds paying higher and higher yields. The world considers the US Treasury Bond as the baseline for a zero-risk investment. And with T-Bond yields going higher in 2022, investors worldwide have been flocking to both the dollar and T-Bills. Continue reading "Is The Bitcoin Crash Over?"

Which Is The Better Gold Mining Stock?

While the general market (SPY) has suffered two violent legs down in its cyclical bear market, the Gold Miners Index (GDX) has suffered three legs down and has seen a much more violent bear market.

This has made the sector fertile ground for new investment ideas relative to other sectors. Still, with mining being a complex business and the gold price being quite volatile, the key to outperformance when dabbling in the sector is to own the highest-quality names.

In this update, we’ll look at two of the largest gold miners globally and determine which is the most attractive name from an investment standpoint - Agnico Eagle Mines (AEM) or Newmont Corporation (NEM).

Scale & Business Model

Newmont and Agnico Eagle Mines (“Agnico Eagle”) share very similar business models, given that they are two of the world’s largest gold producers that receive over 90% of their revenue from gold with limited contributions from other metals.

In Newmont’s case, it is the world’s largest gold producer, with 15 operating mines in Africa, North America, South America, and Australia, and annual production of 6.0 million ounces of gold (+ 1.3 million additional gold-equivalent ounces).

Meanwhile, Agnico Eagle has 13 mines across Canada, Finland, Australia, and Mexico and expects to produce 3.4 million ounces of gold this year.

Based on Newmont having slightly more mines (15 vs. 13), double the production profile, and having a massive development pipeline with over ten projects, it certainly wins from a scale standpoint. This slightly edges out Agnico Eagle’s smaller production profile and less robust development pipeline, though Agnico Eagle still has one of the best development pipelines among its peers.

It is also worth noting that while Agnico Eagle has a smaller production profile and slightly less diversification, its jurisdictional profile is superior, with 95% of future production coming from top-rated mining jurisdictions.

That said, Newmont wins by a hair in this category for investors looking for a global producer with diversity. Continue reading "Which Is The Better Gold Mining Stock?"

These Stocks Are Falling Knives

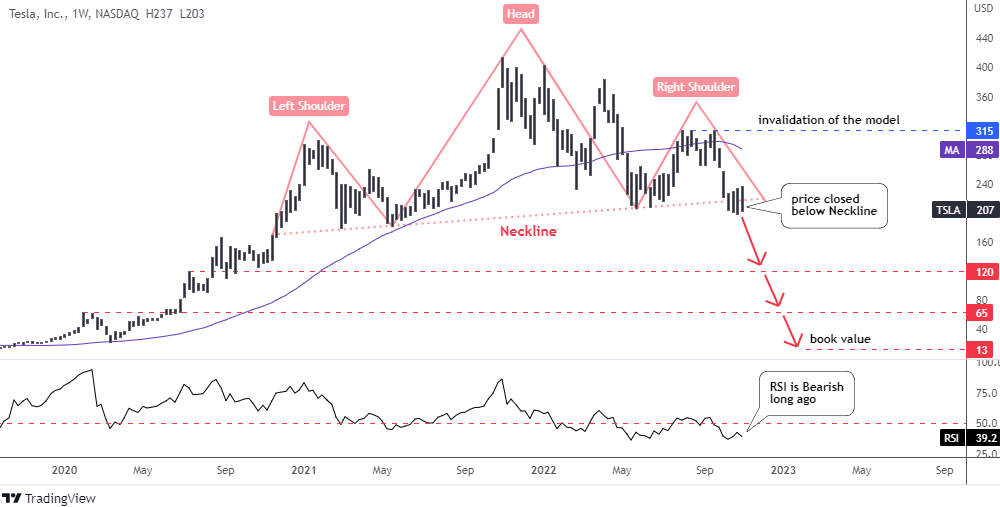
It is good to see a Head and Shoulders pattern in the making and to see it in the final stage is great luck. Fortunately, I spotted one such pattern in the chart of the Tesla (NASDAQ:TSLA)TSLA Weekly Chart

Source: TradingView

The stock price of Tesla has been trading in a big range between $180 and $414 after it managed to break above the Y2020 top of $167. Peak points were distributed unevenly as we can see the lower tops on both sides of the all-time high. This has shaped a notorious Head and Shoulders pattern on the weekly chart.

We saw this model in the Ethereum and AMD charts this year.

The model is clear; it has slightly up-sloping angle as the Right Shoulder is located higher than the Left Shoulder. A Neckline has been built through the valleys of the Head. The stock price has been hovering here for some time.

Last week, the market closed below the Neckline triggering the bearish signal.

The target of this pattern is located in the negative numbers area so I skipped it. Instead, I highlighted three potential supports that could stop the upcoming collapse.

The first support is located at the peak of August 2020 at $120. It was broken to the upside and then it was retested by a huge consolidation.

The next support comes from the top of February 2020 at $65. The price has been struggling to overcome it for a long time. The book value level of $13 is the ultimate support based on fundamental data. Continue reading "These Stocks Are Falling Knives"