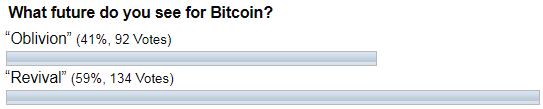
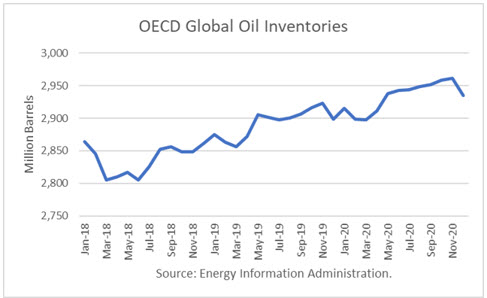
Weekly Futures Recap With Mike Seery

Gold Futures

Gold futures in the August contract is currently trading higher by $12 at 1,440 an ounce after settling last Friday in New York at 1,412 up about $28 hitting a new 6 year high as this market looks to test the 1,500 level in the coming weeks ahead in my opinion.

I'm not involved in gold, but I have bullish positions across the board in the precious metals as I still think gold prices continue to March higher and if you are long a futures contract place the stop loss under the 2 week low which stands at 1,384 as an exit strategy.

Gold prices are trading far above their 20 and 100-day moving average as this trend is strong to the upside as silver prices are up over $0.40 today and still looks very cheap compared to gold prices.

Volatility in gold has accelerated as that is here to stay in my opinion as I think strong demand will continue to support gold and the precious metals across-the-board as U.S. interest rates remain at extremely low levels which is bullish towards the commodity markets.

When you trade the commodity markets finding the trend is the most important aspect as the precious metals have now developed into strong trends as you should have bullish positions, not bearish positions as that would be counter-trend trading.

TREND: HIGHER
CHART STRUCTURE: IMPROVING
VOLATILITY: HIGH

Continue reading "Weekly Futures Recap With Mike Seery"

Precious Metals Big Picture

While many are talking about major new bull markets in gold, silver and the miners I find it safer to set realistic goals within a still very bullish outlook. After all, we became bullish in November, had to retrench due to over-bullish sentiment and fading fundamentals in February (both situations linked here) and then have been back in the bull seat since the gold stock launch as noted on June 3rd.

The point being, I have nothing to prove to you; nothing to woo you and tempt your greed impulse about. NFTRH has simply called the sector in line with its fundamentals and technicals, and that is what we continue to do as of this day. We chart 20 quality miners (+/-) each week and note short-term targets, resistance, etc. for the miners, gold and silver routinely.

The other priority is to stay on top of the still-bullish fundamentals. Most recently silver joined the party and is probably slamming our favored theme into gear, which is for it to take over leadership from gold and potentially lead the macro to a future inflationary cycle. Easy now, that is still in the realm of potential, not yet reality. But all of this fun – and it has obviously been fun lately – takes place against a big picture that is lumbering along at its own pace.

What I like best is that due to the big picture view I can put forth a conservative 2019 plan, and it still calls for a minimum of another 70% upside for the HUI index. Within that, many of the miners we track will do much better. And within that, we have not even seen the speculative end wake up yet. Those would be the little TSX-V type penny stock bottle rockets (lottery tickets) that pull 400% rallies out of nowhere when they finally get played.

Okay, let’s reel it into the lumbering big pictures on HUI, gold, and silver. As noted, there will be bumps and pullbacks along the way. Monthly charts are not preferred for managing those situations so we’ll stick with the dailies and weeklies in NFTRH reports. But with the ferocity of the current rally (and the fundamentals behind it) it appears a good bet that a second leg to the impulsive ‘A’ leg in 2016 is underway after the beautiful consolidation that killed everyone’s spirits (as it should) since 2016. Continue reading "Precious Metals Big Picture"

Bitcoin Loses Its Luster

Hello traders everywhere. Bitcoin experienced one of the most significant daily price losses of the year losing over -13% on Tuesday, its second-biggest daily loss of the year. In turn, that triggered a new red weekly Trade Triangle indicating that we are now in a sidelines position based on the intermediate to long-term strategy. In the short-term, this could be viewed as a switch from a bullish market to a bearish market for Bitcoin.

Why the sudden move lower? I believe it can be directly attributed to the growing calls for regulation of Facebook's Libra project and cryptocurrencies in general. Facebook's plan came under attack at a U.S. hearing this week, with senators calling the company delusional and untrustworthy. They also questioned the social media giant on how it was planning to prevent money laundering. And, a week ago, President Donald Trump called for banking regulation on bitcoin and Facebook's Libra.

Now many in the investor community are beginning to worry that Facebook's Libra project will end up fast-tracking regulations for the crypto market.

What do you think? Will this move by Facebook fast-track crypto regulations?

Key Levels To Watch This Week:

Continue reading "Bitcoin Loses Its Luster"

Restless Bitcoin Makes Fiat Elite Sleepless Again

A year ago, “Bitcoin was at a crossroads” as then I spotted a triangular consolidation on the chart. The price could go both upside and downside, and I marked them as “Revival” and “Oblivion” areas accordingly. Below are your bets for the future of Bitcoin a year ago.

Bitcoin

Crypto enthusiasts are in the majority, although haters scored a hefty 41%. This violent confrontation shows that Bitcoin again threatens the interests of the elite as there are a lot of people, including President Trump, who expresses their opposition to cryptocurrencies as a whole. And it’s a natural course of things as human beings often reject changes and the elite try to shield their ultimate position.

Bitcoin broke both the downside of the triangle and the bearish confirmation level at the $6400 entering the “Oblivion” territory. The bearish target of $1250 had not been reached as the price of crypto gold had reversed ahead of $3000 notch. So, the first move was to the downside, and those of you who chose the “Oblivion” option was right.

This year Bitcoin entered the “Revival” area. It’s time to update the chart, and I am going to start with the monthly time frame. Continue reading "Restless Bitcoin Makes Fiat Elite Sleepless Again"

World Oil Supply And Price Outlook, July 2019

The Energy Information Administration released its Short-Term Energy Outlook for July, and it shows that OECD oil inventories likely bottomed last June 2018 at 2.805 billion barrels. It estimated stocks dipped by 4 million barrels in June 2019 to 2.902 billion, 97 million barrels higher than a year ago.

However, throughout 2019, OECD inventories are no longer expected to rise any further, on balance. At year-end, EIA projects 2019 to be with 2.899 million barrels, 37 million more than at the end of 2018. For 2020, EIA projects that stocks will build 35 million barrels to end the year at 2.934 billion.

oecd oil inventories

The EIA has revised its estimates for future OPEC production down significantly, given the sanctions on both Iran and Venezuela. For much of the balance of 2019 and 2020, it expects OPEC production to remain under 30 million barrels per day. June was reported at 29.8 mmbd.

OPEC has revised its call (demand) for OPEC oil. For 2020, the average is 29.2 mmbd. Therefore, OPEC must cut supply by another 550,000 b/d from June next year just to balance stocks. Continue reading "World Oil Supply And Price Outlook, July 2019"