Are You Waiting Crude Oil At $20?

Last month the crude oil futures hit the target much earlier than it was planned. When the target was reached, I started to think of a reversal to come as the overall structure of the chart implies it. This thought was based on the deep retracement of the price, the overall completion of the pullback, which hit the broken resistance, and not in the last place due to the 100% progress of the CD segment (CD=AB). I shared it with you along with the crucial downside triggers in the weekly chart of my earlier post.

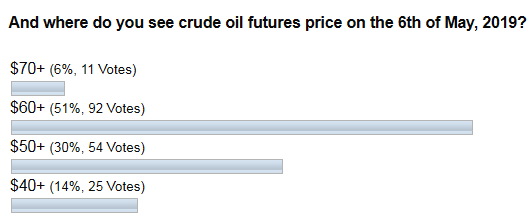
Let’s see how you felt the market those days in the last ballot’s results below.

Crude Oil

You are just amazingly accurate in predicting the future! Again, the majority of you were absolutely right as crude oil futures established a new high of $66.60 beating the earlier top of $64.8 for almost two dollars. I am very grateful to all of you who read my posts here at INO.com and support my chart experiments with likes and votes.

Let’s move on as the weekly chart below shows that not only the new high was established. Continue reading "Are You Waiting Crude Oil At $20?"

Bitcoin Duplicates Gold Chart

“It's not gods who make pots” as investors move the market, pushing the buttons and sending the orders to the marketplace. It’s clear that they tend to behave one way or another, and that’s why patterns exist and appear from time to time as “there is no new thing under the sun.” It doesn’t matter what the instrument is it, let it be a very old commodity or a new digital asset, it is people who “worship” it, make it valuable and move the price of it.

Bitcoin caught the hype again recently after a disastrous 2018 when it was just falling all way down. I would like to share with you an interesting similarity in the chart structure of “perpetual” gold and Bitcoin aka “new gold” to find out if this rally is a part of something bigger.

Do you think Bitcoin is a good investment?

View Results

Loading ... Loading ...

Let’s start from the monthly gold chart as it is a model for the Bitcoin chart. Continue reading "Bitcoin Duplicates Gold Chart"

Gold Update: Calm Before Storm?

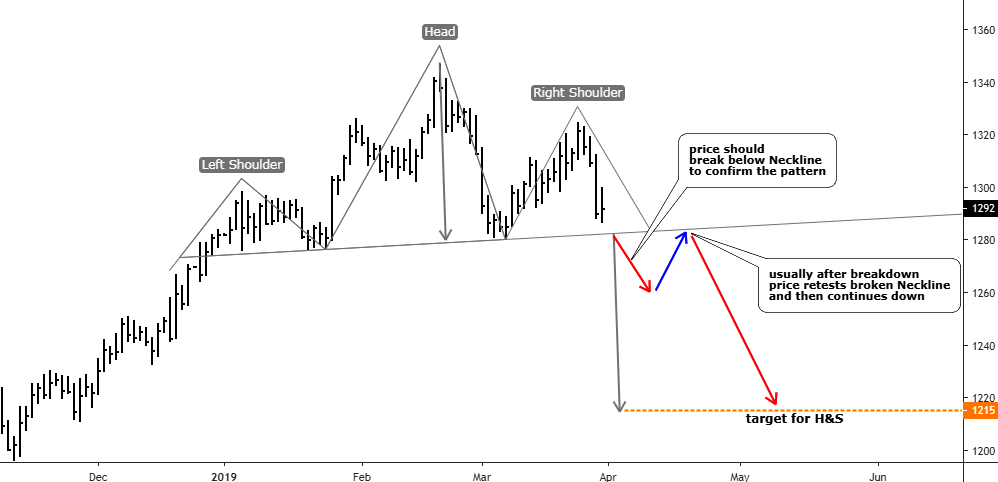
Last month I spotted the reversal Head & Shoulders pattern on the daily gold chart and shared it with you. Let’s see how it played out.

I entered the replay mode on the chart below and deleted the bars that appeared after the previous post to show you what I was expecting from the Head & Shoulders pattern. I would like to add more educational annotations for you in this post.

Head & Shoulders pattern
Chart courtesy of tradingview.com

The previous annotations were switched to gray except the target level for the Head & Shoulders pattern. So, what I was expecting to appear on the chart? First of all, there should be a breakdown below the Neckline, which would confirm the pattern (short red down arrow). Usually, after the breakdown, the price retests broken Neckline (blue up arrow). Only then, the market continues its move in the direction of a target (long red down arrow). Continue reading "Gold Update: Calm Before Storm?"

S&P 500: Drag & Drop?

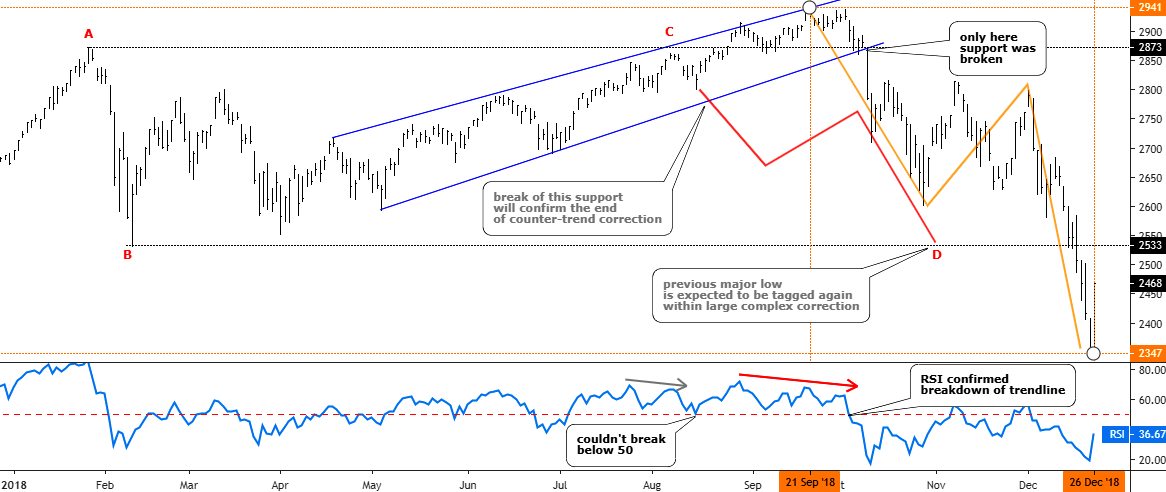
Last August I was thinking of the S&P 500 index and wondered if its uptrend had been exhausted on its way to the upside. The price was at the $2833 level, and it failed to break the earlier top of $2873. The RSI showed the Bearish divergence and the index started to drift lower. I thought it was a complex correction and another drop to hit the lower bound of the $2533-$2873 range was considered to be imminent. The majority of you supported this idea.

Let’s check the updated chart below to see what happened next.

Updated S&P Daily chart tailored in August 2018.

LLLL
Chart courtesy of tradingview.com

As we can see from the chart above the idea itself was good as the price not only retested but just smashed the so-called “bottom” of the range. The actual CD segment, which initially was thought to be equal to AB segment, had reached the ratio of 1.75 exceeding the next most common after 1:1 ratio of 1.618 (Fibonacci ratio) amid the panic sell-off. The trigger, which was set on the downside of the blue uptrend, was right as the index didn’t look back until the very bottom after it fell out of that blue uptrend. That move was accurately confirmed with a breakdown of the 50 level on the RSI sub-chart. The predicted zigzag structure of the drop also appeared to be correct as it is natural market behavior when one market stage changes the other. And talking about where we were right, I also would like to show you the ballot results on the timing of the bottom of the drop. Continue reading "S&P 500: Drag & Drop?"

Crude Oil Hits The Target Early

Back in February, I wondered: “How Far Could Crude Oil Go?” As this commodity confirmed the upside reversal breaking above $54.6. We are still living in a “PetroWorld” therefore the price of oil is crucial, and it impacts all of us around the globe. So, we should watch it carefully.

I spotted a structural similarity on the weekly chart, which was cloned and applied to the current pullback of oil price on the lower time frame daily chart. The price target was set at the $63.7 and the time goal was set on the 6th of May, 2019.

Before we move on to the updated daily chart, I would like to show you the results of your ballot on this topic.

oil price

I can’t express all my gratitude for your voting activity and support of my experiments. The results in the diagram above show that you also saw the area above $60 as a target for the current pullback. It is yet early to say if the price has topped already, but our initial target was achieved and even was passed over ahead of time.

In another ballot, you voted for the instruments you liked the most. Continue reading "Crude Oil Hits The Target Early"