Crude Oil vs Platinum: You Bet Right

It is just amazing how many times you guess not only the direction but also the peaks and troughs of the prices of different instruments. This is crowd-thinking or crowd-analyzing, when the winning ideas are crystallized into the major wager.

This “market distortion” was spotted in July and it was updated this September. Almost all of you were betting that crude oil and platinum would meet on the price chart again. So, here it is in the chart below.
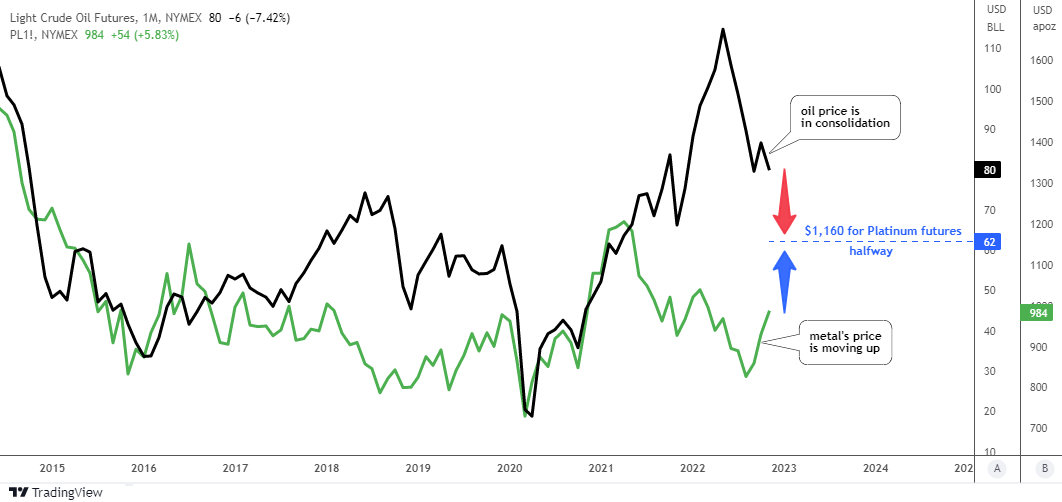
Crude Oil VS Platinum

Source: TradingView

The magic of your major bet is right here in the making. As the oil price remains stuck in a sideways consolidation, the platinum price is taking quick steps towards "black gold".   

In September, crude oil futures completed their mission as the initial meeting point was set at $75 and the valley was at $76. Hence, the consolidation that followed gave the metal a chance to catch up.

The updated meeting point has been recalculated to be set at $62 for crude oil futures and at $1,160 for platinum futures. This could happen in an ideal situation. Historically, however, one of the instruments has often lagged behind.

Last time I updated the platinum futures chart for you and it played out well according to the bullish option.

Let me update the oil futures chart this time as it has changed a lot. Continue reading "Crude Oil vs Platinum: You Bet Right"

Oil: Is It 2014 All Over Again?

Lior Alkalay - INO.com Contributor


In the past two weeks, crude oil futures took a beating; WTI futures ended last week at $46.47 per barrel while futures for Brent crude, the global benchmark, closed at $49.47 per barrel. Both WTI and Brent contracts have now concluded a 15% and 16% fall from their respective peak prices, closing at their lowest point since the deal between OPEC oil producers and 13 non-OPEC oil producers was signed. And the outlook for oil is not encouraging as a broader analysis of both the fundamentals and technical at play reveal a worrisome pattern—a pattern of an oversupplied oil market, ready to nose dive, as it did in 2014.

At the heart of the matter, as in 2014, is the US shale oil industry. Only this time around the US shale industry is significantly more competitive. According to Ron Ness, president of the North Dakota Petroleum Council quoted by Reuters, “the cost of extracting oil at Dunn County, North Dakota, is as low as in Iran” and “the cost of producing a barrel of oil is at $15 and falling" That figure is truly nothing short of dramatic! True, the production cost at Eagle Ford and Permian Delaware facilities is higher than Dunn country. And yet this figure underpins a very important change. In the next oil slump, shale producers won't be under the same pressure to cut production. Meanwhile, oil production in America has risen to 9.29 million barrels a day and is expected to surge to 10 million barrels a day by 2018. All the while, crude oil inventories are stubbornly high. The latest data from the EIA shows crude oil inventories were at 527.8 million barrels, at the higher end of the 5-year range. In fact, as the EIA chart below shows, US crude oil inventories have been persistently above the 5-year range for some time, suggesting demand for crude in the United States is too weak to accommodate the rising supply from shale oil. Continue reading "Oil: Is It 2014 All Over Again?"

What OPEC Cut Is Priced-Into The Crude Oil Market?

Robert Boslego - INO.com Contributor - Energies


As all seasoned traders know, oil futures contracts reflect the market’s probability-weighted price expectations. In addition, I believe that the market provides a risk premium to the long side which underprices oil to some extent.

One important question now is how much of a potential OPEC/Non-OPEC cut is already priced into futures contracts? The answer determines the risk-reward to being long or short, depending on the outcome of the 171st OPEC Meeting on November 30th.

Before going further, there is no definitive financial theory or procedure of telling specifically. So I have to make some informed guesses based on possible outcomes and past market reactions. Continue reading "What OPEC Cut Is Priced-Into The Crude Oil Market?"

Copper Waits If Oil Keeps Upside; China Is In Focus

Aibek Burabayev - INO.com Contributor - Metals


Chart 1. Crude Oil-Copper Correlation: Gap Widened

Crude Oil-Copper Correlation
Chart courtesy of tradingview.com

Another attempt by oil to close above the psychologically important $50 level (black dashed horizontal line) has failed. This was the third and a good try, and it was after a good correction in July, which makes bulls nervous as they lose their patience. Copper couldn’t keep the correlation gains achieved in July as it didn’t follow the rising crude last month and on the contrary, it moved the opposite way below the $2.2 level. The gap between them widened.

It’s not all bad news. There are at least two positive factors: Continue reading "Copper Waits If Oil Keeps Upside; China Is In Focus"

Freeport-McMoRan Could Double Amid Strong Copper

Aibek Burabayev - INO.com Contributor - Metals


Copper advanced 15 cents or 7% higher from my previous post and it looks like we are going to see much more strength as it was just a warming-up.

Chart 1. Copper-Oil Weekly: The Metal Tries To Catch Up Consolidating Crude

Chart 1. Copper-Oil Weekly: The Metal Tries To Catch Up Consolidating Crude
Chart courtesy of tradingview.com

The comparative chart above became a tradition. This time, there are no dramatic changes on it and the only drama here is the failure of crude oil to surpass the first strong barrier at the $50 mark (black dashed horizontal line). Oil has been stuck in a $5 range between $45 and $50 levels. We are at a crucial point as soon we will know for sure if it was a strong correction in oil before another huge drop to the $26 low or below or is it a consolidation before the break through $50 and then $60 barriers within a new uptrend. Continue reading "Freeport-McMoRan Could Double Amid Strong Copper"