U.S. Crude Production Shows No Signs Of Bottleneck

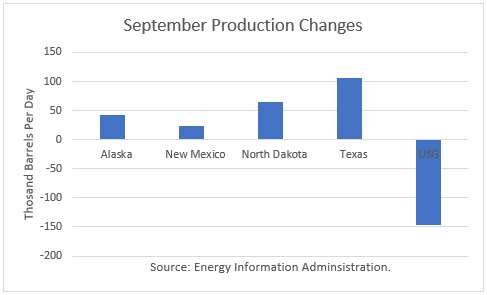
The Energy Information Administration reported that August crude oil production averaged 11.475 million barrels per day (mmbd), up 129,000 b/d from August. The gain was led by a 106,000 b/d increase in Texas, a 64,000 b/d rise in North Dakota and a gain of 24,000 b/d in Mexico. Seasonal factors affected the overall gain, as production fell by 147,000 b/d in the U.S. Gulf and rebounded by 43,000 b/d in Alaska.
permian basin

The EIA-914 Petroleum Supply Monthly (PSM) figure was 438,000 b/d higher than the weekly data reported by EIA in the Weekly Petroleum Supply Report (WPSR), averaged over the month, of 11.037 mmbd. Continue reading "U.S. Crude Production Shows No Signs Of Bottleneck"

December OPEC Meeting Preview

When the OPEC-Non-OPEC Joint Ministerial Monitoring Committee (JMMC) convened in Abu Dhabi, United Arab Emirates in mid-November, it reported in a press release:

The Committee reviewed current oil supply and demand fundamentals and noted that 2019 prospects point to higher supply growth than global requirements, taking into account current uncertainties. “The Committee also noted that the dampening of global economic growth prospects, in addition to associated uncertainties, could have repercussions for global oil demand in 2019 – and could lead to widening the gap between supply and demand.”

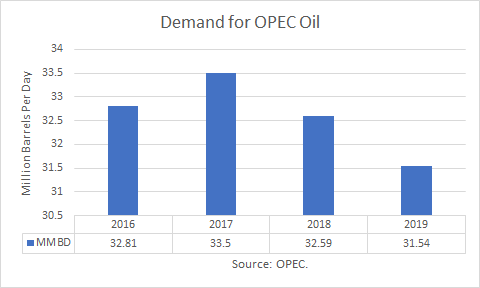
The figures they were reviewing were later released by OPEC in its November Monthly Oil Market Report. For 2019, they are projecting a decline in the demand for OPEC crude oil of about 1.04 million barrels per day to 31.54 mmbd. OPEC’s October production was estimated at 32.9 mmbd.

saudi energy minister khalid
Continue reading "December OPEC Meeting Preview"

Will Oil Find Support Near $60?

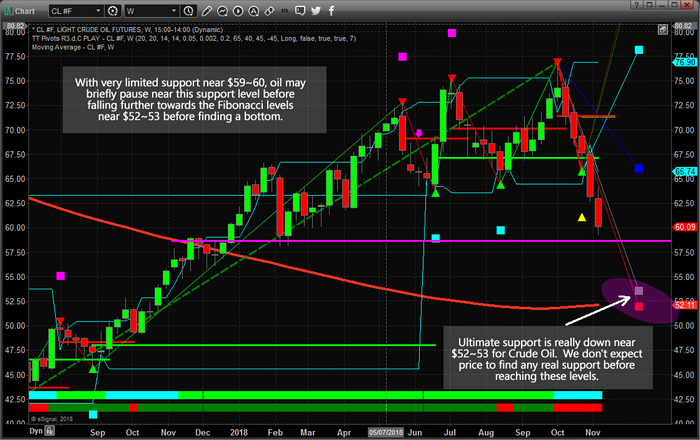
Our research team warned of this move in Crude Oil back on October 7, 2018. At that time, we cautioned that Oil may follow a historical price pattern, moving dramatically lower and that lows near $65 may become the ultimate bottom for that move. Here we are with a price below that level, and many are asking “where will it go from here?”.

We believe the support near $65, although clearly broken, may eventually become resistance for a future upside price move. Our proprietary Fibonacci price modeling system is suggesting a new target near $52~53, and we believe this downside move in Oil is far from over at this point.

global climate

The current global climate for Oil is that suppliers are pumping more and more oil into the market at a time when, historically, prices should continue to decline. One of our research tools includes the ability to identify overall bias models for each week, month or quarter. Traditionally, Oil is dramatically weaker in November and relatively flat for December. Continue reading "Will Oil Find Support Near $60?"

World Oil Supply, Demand And Price Outlook, November 2018

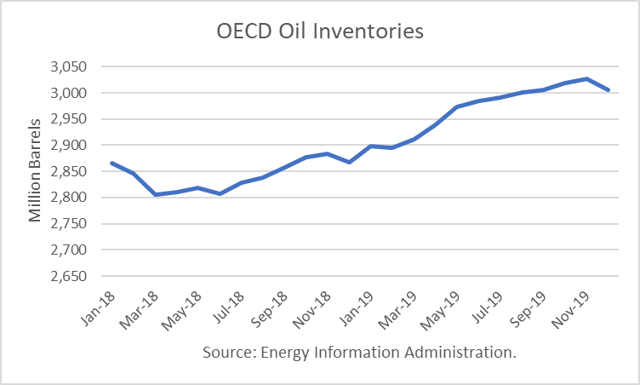
The Energy Information Administration released its Short-Term Energy Outlook for November, and it shows that OECD oil inventories likely bottomed in June at 2.807 billion barrels. It estimated a large 20 million barrel gain for October. Though it forecasts that stocks will drop in December to 2.867 billion, that is 50 million barrels higher than in the October outlook.

Throughout 2019, OECD inventories are generally expected to rise, reaching 3.0 billion barrels in August. It projects ending the year with 138 million barrels more than at the end of 2018 in glut territory.

OECD Oil Inventories

The moment of truth has come, and it appears that the sanctions will cut less of Iran’s production and exports than has been added by OPEC+ producers and the U.S. That is why oil prices have been dropping for eight straight sessions.

Oil Price Implications

I performed a simple linear regression between OECD oil inventories and WTI crude oil prices for the period 2008 through 2017. As expected, there are periods where the price deviates greatly from the regression model. But overall, the model provides a reasonably high r-square result of 79 percent. Continue reading "World Oil Supply, Demand And Price Outlook, November 2018"

Positive Implications For Gold Miners If Crude Oil Breaks Down

It’s an over obsessed upon commodity, previously hyped for its (Hubbert’s) “peak” status by “experts” like T Boone Pickens and a whole clown show of promoters.

Now WTI Crude Oil has reached a thick resistance zone (as managed in NFTRH for the last couple of years) and may be breaking down from a peak of a whole other kind. Here is the monthly chart we use.

Gold Miners

It is preliminary, and one weekend OPEC jawbone could put oil back up in the consolidation. But as of now the price has ticked below the previous 2018 low to close the week. It is not a good look… unless you’re a gold bug, that is. More on that later. Continue reading "Positive Implications For Gold Miners If Crude Oil Breaks Down"