Is This ETF Laying The Foundation For A Rally In Crude Oil?

Picking bottoms is not something one should do if you're going to be a successful trader. But looking at market that may be forming a bottom is a good exercise, and one that you should be doing on a regular basis.

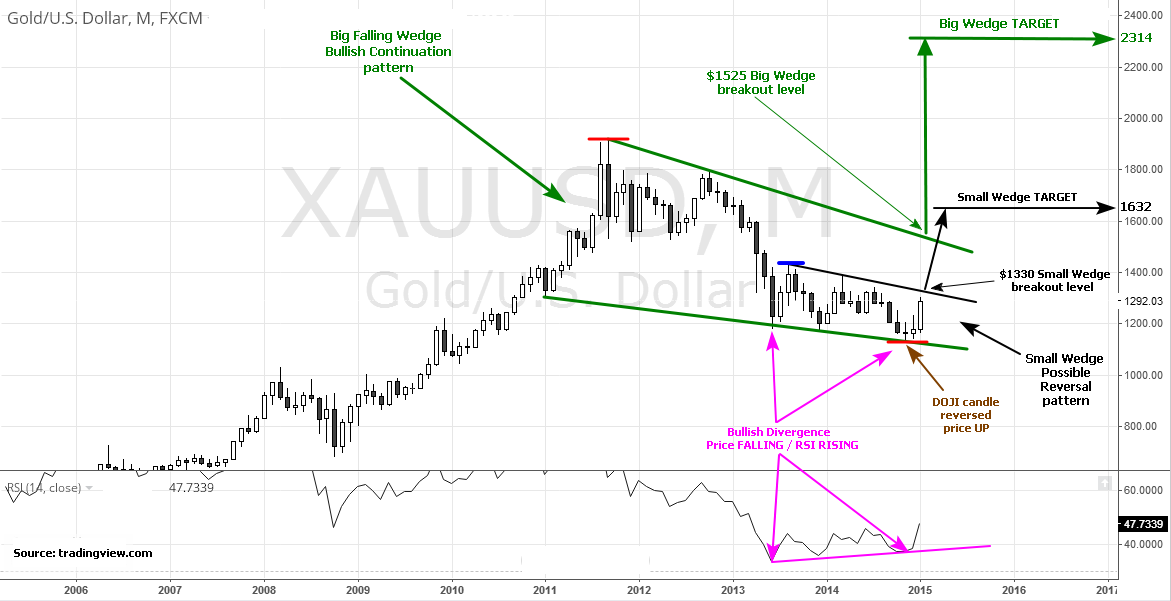
I had done this before gold reversed to the upside traded over $1300 an ounce. Maybe it's time to look at crude oil and see if it's beginning to set itself up for a move to the upside.

Technically, the Trade Triangles remain negative on crude oil, so there is no reversal showing up with those technical tools.

The story is a little bit different with the RSI indicator. This particular indicator is showing that there is a big positive divergence on the Energy Select Sector SPDR ETF (PACF:XLE), and it is one that spans months.

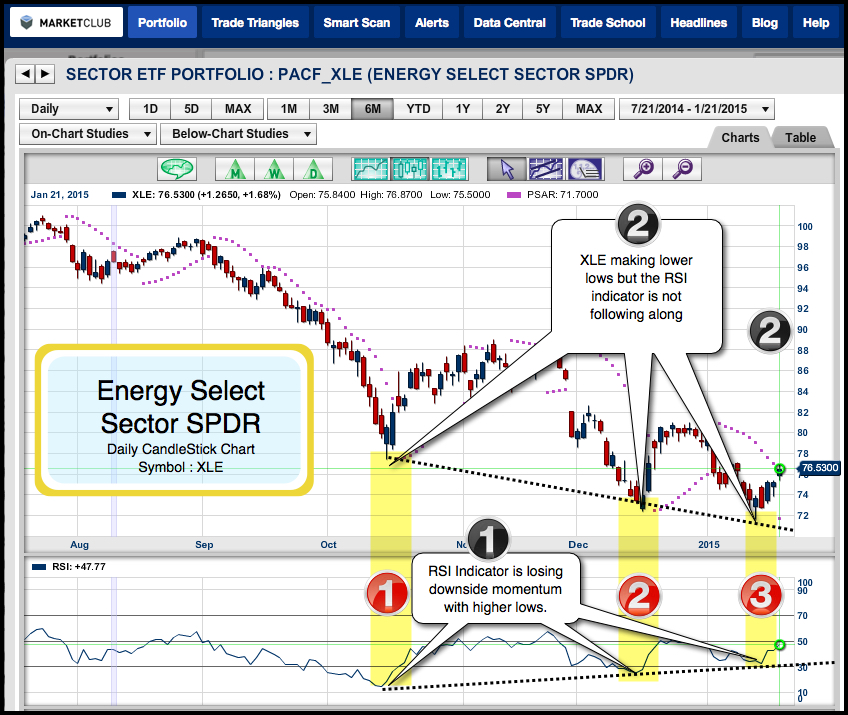
Today I'm looking at the ETF XLE and the fact that if it closes higher for the week, it will be a positive sign. The previous week saw a very important Japanese candlestick formation call a "Dragon Fly Doji" this can be interpreted as a strong indication of reversal. It all depend's on how XLE closes this Friday. Continue reading "Is This ETF Laying The Foundation For A Rally In Crude Oil?"

Gold Update: Total Recast

Aibek Burabayev - INO.com Contributor - Metals


Dear INO.com readers,

Today Gold hit the $1300 level and I updated my chart for Gold, as it was price trigger for my previous bearish scenario.

In my first article last December I charted the line graph for Gold with a descending triangle pattern detected on this metal. My projection for the mentioned pattern was bearish with quite bold target levels.

What is up today?

The main rule for success is to not to be biased and always challenge yourself with making a brand new analysis from time to time, and surely when market is not going your way.

Today I prepared an absolutely new Gold graph to put fresh eye on it, now with candlesticks.

Gold Chart, small and big wedge chart patterns.

This time I detected a very interesting chart pattern called the “wedge.” This type of patterns is outstanding as it has an ambiguous impact on the market with either a continued or reversed outcome. Luckily, we have two wedges on the same time frame at once. Both are the falling wedge type because of the descending highs and lows. The big one is highlighted in green and the small is in black. Apart from it, we have two more rare technical species on the chart. Continue reading "Gold Update: Total Recast"

Using The Doji Indicator To Determine A Market Trend

Trader Larry Levin, President of Trading Advantage LLC, has agreed to share one of his favorite trading secrets as a special treat to our viewers. Determining a trend can often be tricky. Get Larry’s expert opinion on how to keep it simple. If you like this article, you won’t want to miss his secret one-time framing technique!
---------------------------------------------------------------------------------------------------------------------------------------------------------------------------------------

Using the Doji

On a candlestick chart, there is a pattern that technicians refer to as a doji. A doji has top and bottom shadows like a regular candlestick, but has practically no real body. This happens when the opening and closing price are the same, or so close that they just leave a sliver of a real body. A doji looks like a plus sign or cross.

Finding a Doji can tell a technical analyst key things about a market trend

Doji are considered a good sign of indecision in a market. Finding a doji with short and nearly identical shadow points suggests a neutral trading session. The market opened, had a small trading range, and then closed at the opening price. Neither bulls nor bears got the upper hand. Longer shadows show potentially greater indecision. They are neutral on their own, but paired with a trend, a doji can hint at a coming change. Continue reading "Using The Doji Indicator To Determine A Market Trend"

Momentum, Reversals, and Bar Patterns

Last week AJ Brown from TradingTrainer.com gave us a great article to 'chew on' covering OTM near-term vertical debit spreads. The response was pretty good, but I think we'll get him an even greater number of comments with this article on momentum, reversals, and bar patterns. Please enjoy the article and if you haven't done so yet, I recommend you check out AJ's training videos as you'll learn a TON!

==================================================================

Every day’s bar tells us something about what to expect the next trading day. In other words, today’s bar affects tomorrow’s bar. So how do we know what that effect will be?

Not every bar will give you clear insight into where the market is headed. But there are certain bar patterns that are more informative than others. Allow me to share a few of these bar patterns with you.
You can often determine if the next trading day is going to be an up day or a down day by looking for a “key reversal up” or a “key reversal down.”
Continue reading "Momentum, Reversals, and Bar Patterns"

Today's video is special ... Google, Gold and Crude Oil.

In many of my previous videos we've looked at charts using Japanese candlestick charts. While this is interesting, I've never quite explained to you some of the powers behind using Japanese candlestick charts.

So here's what we are going to do; watch the video, and I will point out to you some powerful Japanese candlestick formations on Google, Gold and Crude Oil.
MarketClub is making available to you with just a phone call a very special PDF booklet on Japanese candlestick charting. The title of the booklet is "17 Moneymaking Candlestick Formations You Can Use Today".

So enjoy the video and be sure to give us a call to request your complimentary copy of this valuable booklet. I believe it will give you a greater understanding of the markets and how they work. The number to call is 1-800-538-7424 ... if you're calling from overseas, use 410-867-2100.

Thanks,
Adam Hewison
President, INO.com
Co-Creator, MarketClub