Dollar Index Hits Your Target And More

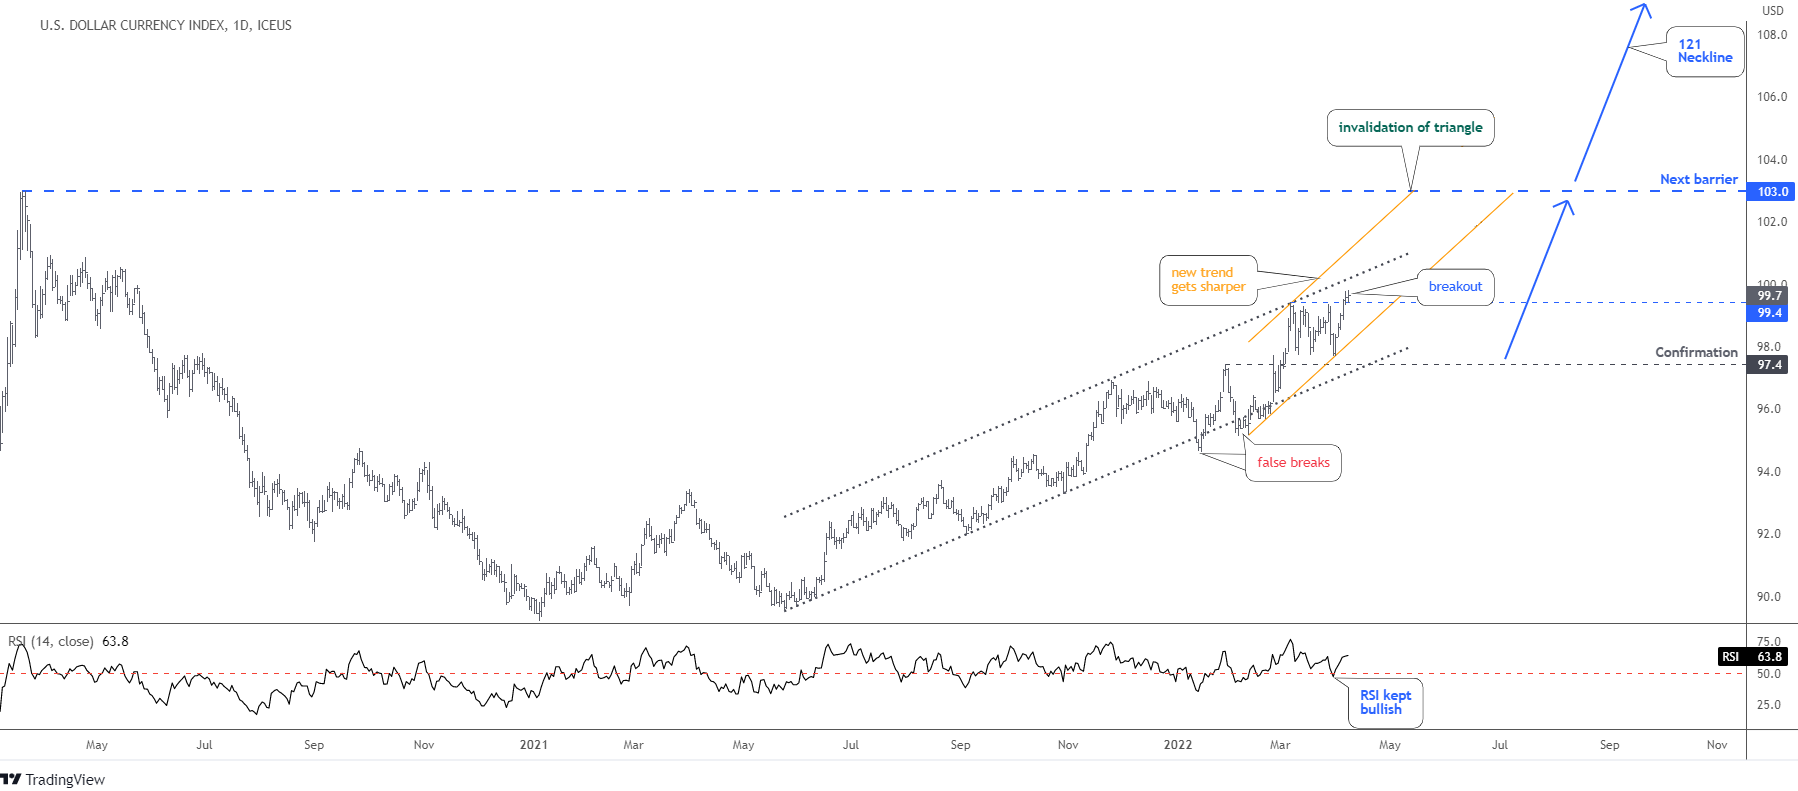
Three weeks ago, I shared the chart of the U.S. Dollar Index (DX) with a bullish outlook.

You supported the idea with the most votes given to the conservative target of $103 located at the peak of Y2020. Your winning vote played out last Wednesday, the 27th of April. Kudos to all of you.

It is time to dust off the big chart again to update on further prospects.

Dollar Monthly Chart

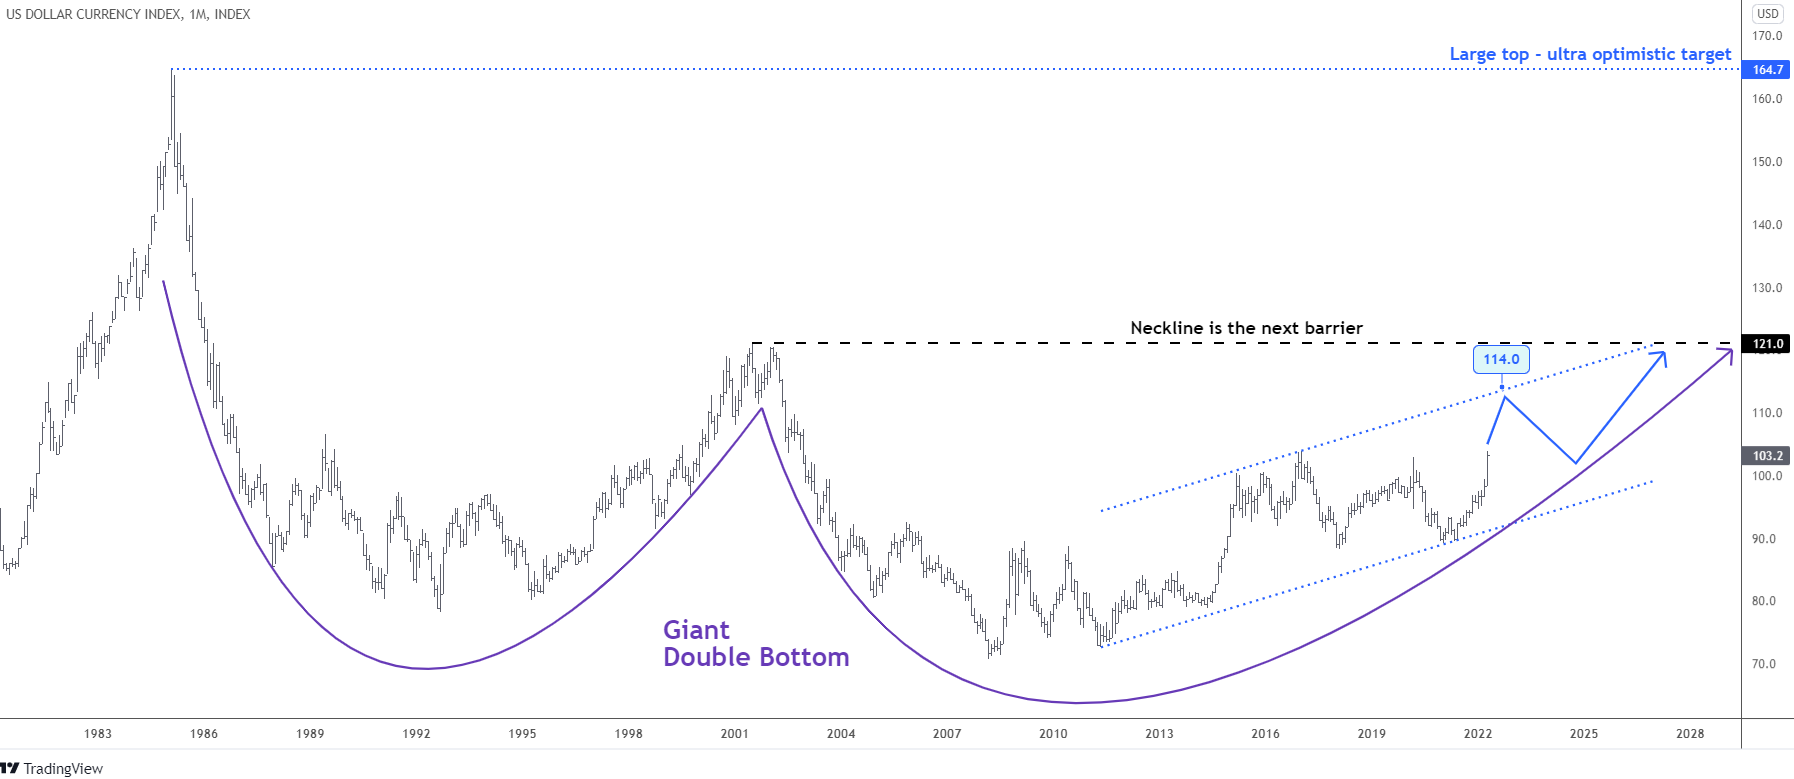
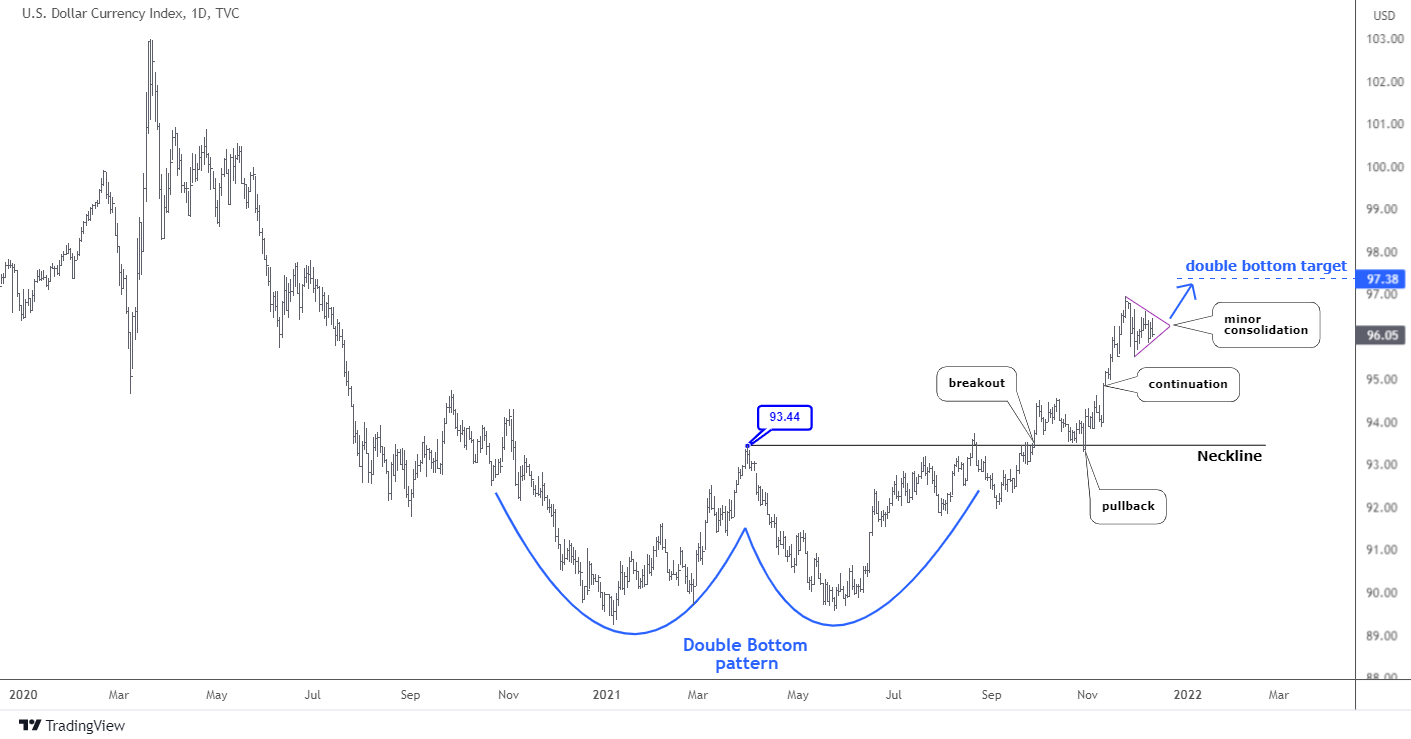
The green triangular scenario has been eliminated as the price surpassed the last year’s peak of $103. The least favored blue path is the primary plan now. I turned the blue arrow into a blue zigzag as the price could take a break after hitting the upside of the blue dotted trend channel around $114.

The next barrier (black) of the Neckline (Giant Double Bottom pattern) is located at $121. It is that very target I was calling for in the title of the previous post.

It is too early to talk about the plan in case the Neckline is broken, although we have no other large barriers beyond, except the all-time high at the peak of the distant 1985 of $164.7. It would be an ultra-optimistic target with the total dominance of the dollar across the globe.

Where do you think the dollar index will stop?

View Results

Loading ... Loading ...

I want to show you one chart below that could shed light on why the dollar could rise further.

Historic Interest Rate Chart

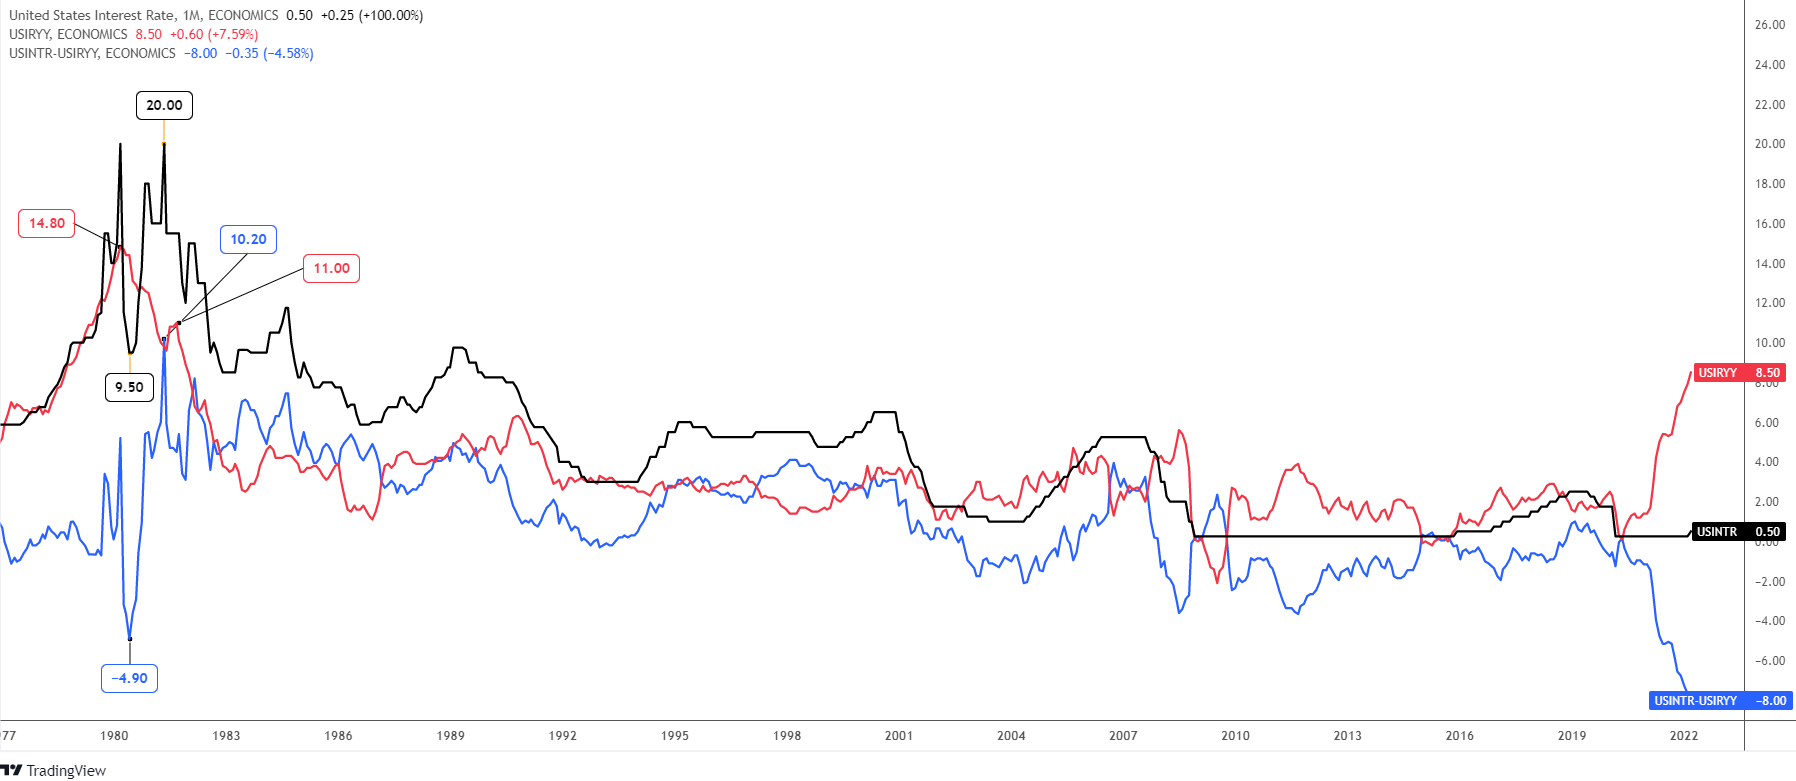
There are three lines in the chart above that represent the U.S. interest rate (black), U.S. inflation rate YoY (red), and the U.S. real interest rate (blue). It starts from 1977, and for the considered period, the current real interest rate has the most negative reading of -8%. Thus, the Fed has been forced to admit that this raging inflation is not transitory, and it should respond appropriately to take the rising prices under control. This week, the market expects a 50 basis point hike from the Fed; this would double the interest rate to 1.00%.

In 1980, the real interest rate had dived deep into a negative area to hit the valley -4.90% amid the strong inflation above 14% and the falling interest rate (9.50%). This triggered the fast-paced tightening of the monetary policy as the Fed rate more than doubled to hit the earlier top of 20% in just one year. The inflation quickly dropped to single-digit numbers under such severe pressure. Indeed, the real interest rate made a V-turn accordingly to match even with the inflation rate of around 10%.

If we take history as a sample, the Fed could take the interest rate much higher beyond the most hawkish expectations. The simple calculation shows that the Fed rate topped at the ratio of 1.35 to the peak inflation rate (20/14.8). Applying this math to the current situation, we should multiply 1.35 by 8.5% of the inflation rate. Then the Fed should hike up to 11.5%, an unbelievable number! Although, it will not update the all-time high.

The time lag between the peaked inflation and the first hike was almost a half year in the past. This time, the Fed took the first step almost immediately if we take the March inflation reading as the peak. It could change the size of the tightening, as the speed really matters.

Do you think the Fed rate could hit 11.5%?

View Results

Loading ... Loading ...

The higher the real interest rate, the more attractive the currency is. The hawkish Fed could spur even stronger demand for the U.S. dollar.

I am eager to see your opinion in the comments below, as it has enriched our view many times before.

Intelligent trades!

Aibek Burabayev
INO.com Contributor, Metals

Disclosure: This contributor has no positions in any stocks mentioned in this article. This article is the opinion of the contributor themselves. The above is a matter of opinion provided for general information purposes only and is not intended as investment advice. This contributor is not receiving compensation (other than from INO.com) for their opinion.

U.S. Dollar To Hit $121; Crude Oil To Hit $176?

It turned out that the dollar weakness we observed in February was about to be over right after the earlier update. I thought we would see more downside for the DX in the area between 94.4 and 92.5 (Fibonacci retracement levels) before the rally resumes, and most readers supported that idea. However, the rally started immediately.

The inflationary pressure underpins the dollar, as the Fed has turned strongly hawkish on the interest rate and tapering. Let us check out the updated daily chart below.

Dollar

In my previous post, we saw the DX piercing down the dotted gray uptrend. Those punctures turned out to be false breaks, as fallouts of the channel were temporary, and the move up resumed overcoming above the preset confirmation level of 97.4. Continue reading "U.S. Dollar To Hit $121; Crude Oil To Hit $176?"

Dollar Fades After Hitting The Target

Last December, in the post titled "Is The Dollar Going To Steal The Santa Claus Rally?" I had shown you how a well-known “Double Bottom pattern” had been emerging in the daily chart. According to your voting, most of you have spotted that model as well.

I put the updated chart below to show you the path of the price on its way to the target.

Dollar Chart

The dollar index (DX) has tried to climb over the previous top right after the post. This promising attempt has failed (red X), turning into the deeper complex consolidation (red down arrow). The good thing from a technical point of view was that the price has remained above the Neckline, although the depth of correction was scary. Continue reading "Dollar Fades After Hitting The Target"

Gold Is Well-Behaved, But Silver Is Not

Sometimes we cannot rely on the correlation between certain instruments as they suddenly interrupt the link. I added the U.S. dollar index (DXY) chart below to illustrate it.

Silver Dollar Index

Surprisingly, gold's correlation (orange indicator sub-chart) went into a positive territory recently as it reached quite a decent number of 0.49 with an absolute correlation at 1.00.

Simultaneously, silver shows an almost neutral link, although it usually has a negative reading. All three of them dropped, but at a different speed. It indicates that the market has switched to the risk-on mode as safe havens were dumped. This time silver's dual nature showed up as it could shine when the world is a gloomy place, and when the world needs it as an industrial metal.

Now, let's look at Continue reading "Gold Is Well-Behaved, But Silver Is Not"

United States Still Going Bananas

You see, it’s not a Trump thing. It’s an ‘America is so hopelessly indebted (as are other developed economies) that they have no choice now’ thing.

However, the election shakes out – most likely Democrat president and congress, Republican senate – the stock market is cheering two things in my opinion. It is cheering US dollar compromising fiscal stimulus (Fed prints, politicians spend) and the coming of more US dollar compromising monetary policy (Fed prints, Fed monetizes bonds AKA debt, Fed screws with any other esoteric tool it can get its hands on in the age of MMT TMM, AKA Total Market Manipulation).

I have a still profitable position against the Euro that is about to tick un-profitable this morning. That was my hedge against a firming US dollar, which is the anti-market to the US stock market especially, but also to many global markets because I am long US and global stocks. I may have to pull back to hedging stocks (including gold stocks) with high cash levels. So says the ongoing inflationary operation.

I had projected an A-B-C bear market bounce in Uncle Buck, just to keep the macro honest and put a spook into market bulls. But it appears – due to the joy breaking out everywhere – that I will have been wrong about ‘C’. That’s what this breakdown below support (now short-term resistance) says, anyway.

dxy market

We are going bananas not because Trump is/was just another politician when it comes to the modern American tradition of debt-leveraged inflation to disenfranchise the middle and poor and enrich the already spectacularly wealthy. We are going bananas because Continue reading "United States Still Going Bananas"