Three Silver Miners On The Sale Rack

While the gold price has managed to hold onto most of its Q1 gains amid the market turmoil, the silver price has not fared nearly as well. In fact, the metal is sitting at a (-) 5% year-to-date return after briefly being up 16% for the year at its March highs. This retracement in the silver price has put a severe dent in margins for silver producers, explaining why the silver miners have significantly underperformed the metal. However, with the Silver Miners Index (SIL) now down nearly 50% from its Q3 2020 highs, this negativity related to weaker margins looks to be mostly priced in, suggesting it’s time for investors to be open-minded to a bottom in the higher-quality names. Let's take a look at a few of the top names sector-wide below:
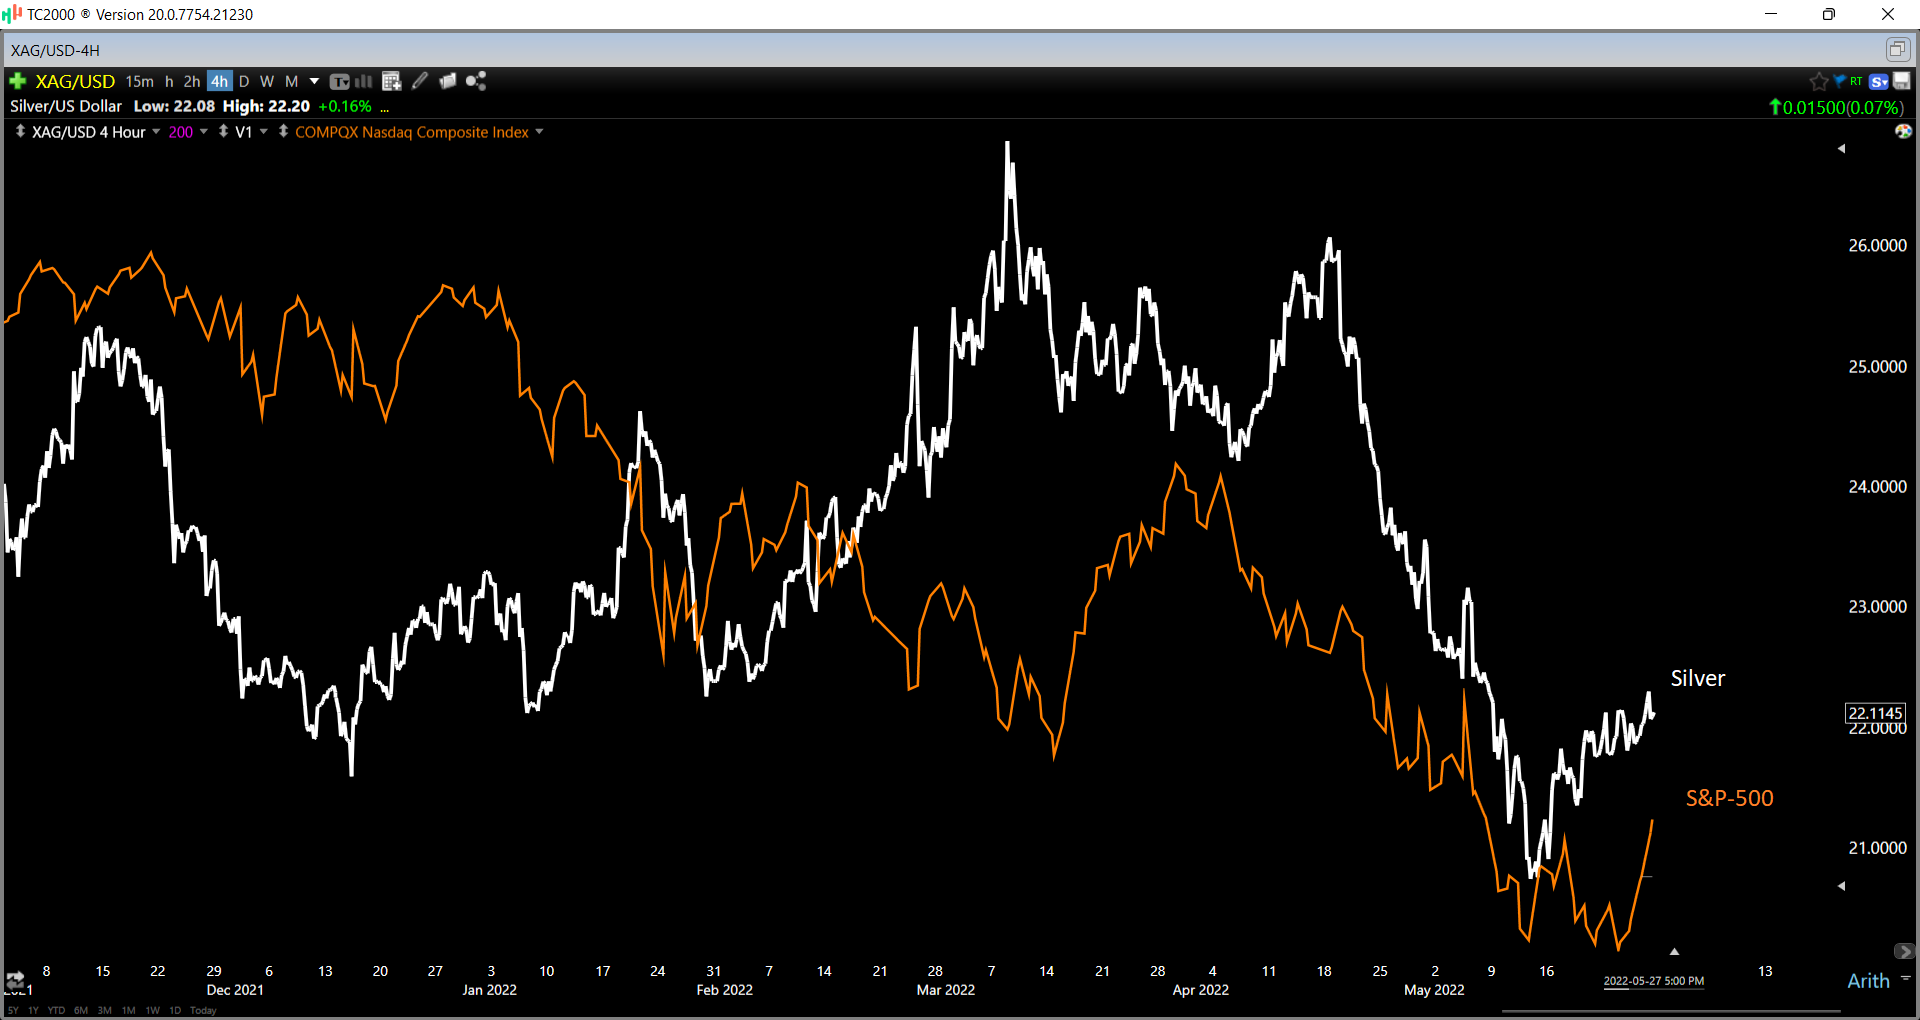
Silver Daily Chart

Source: TC2000.com

Many investors prefer to invest in SIL or the physical metal when it comes to gaining exposure to silver, but neither the ETF nor metal pay dividends and the former is full of poorly run companies with razor-thin margins. For this reason, investing in SIL is even worse than investing in the Gold Miners Index (GDX), where at least the latter has a decent portion of solid companies which balance out the laggards. Given the low quality of SIL, the best way to invest in silver is by selecting the best names sector-wide, and three names that stand out are Continue reading "Three Silver Miners On The Sale Rack"

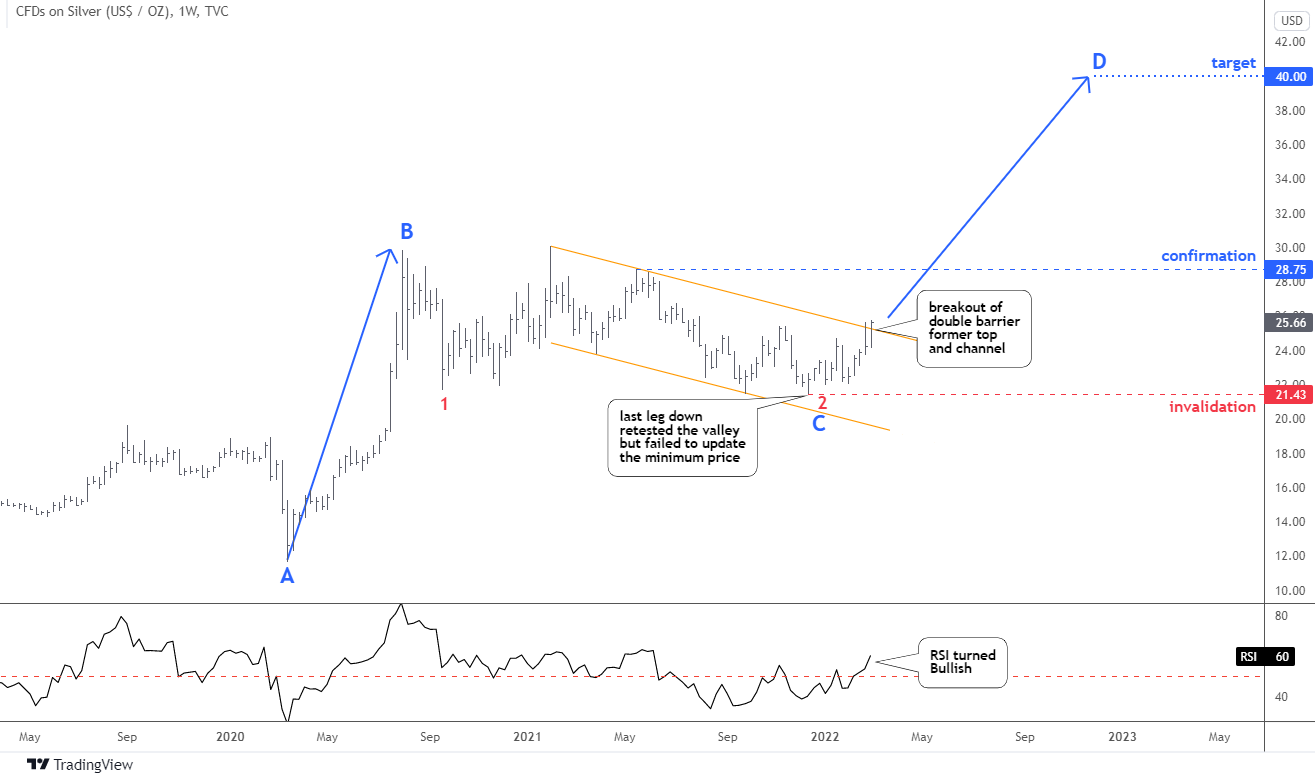
Silver Update: $40 Then $81?

The title of this post is not clickbait; please keep reading until the end to see why silver can hit these levels.

The bullish pattern is shown in the dollar index chart in my December post with a question in the title "Is The Dollar Going To Steal The Santa Claus Rally?" played out as planned to destroy the rally of top metals.

Let us see the updated silver chart below.

Silver Chart

The previous bullish setup for silver has been annihilated by the ongoing strength of the dollar. The price has dropped in another leg down to retest the former valley of $21.43. It has failed to update the minimum price as it stopped right there, and then the price bounced to the upside. Continue reading "Silver Update: $40 Then $81?"

Santa Claus Rally Kicks Off For Gold

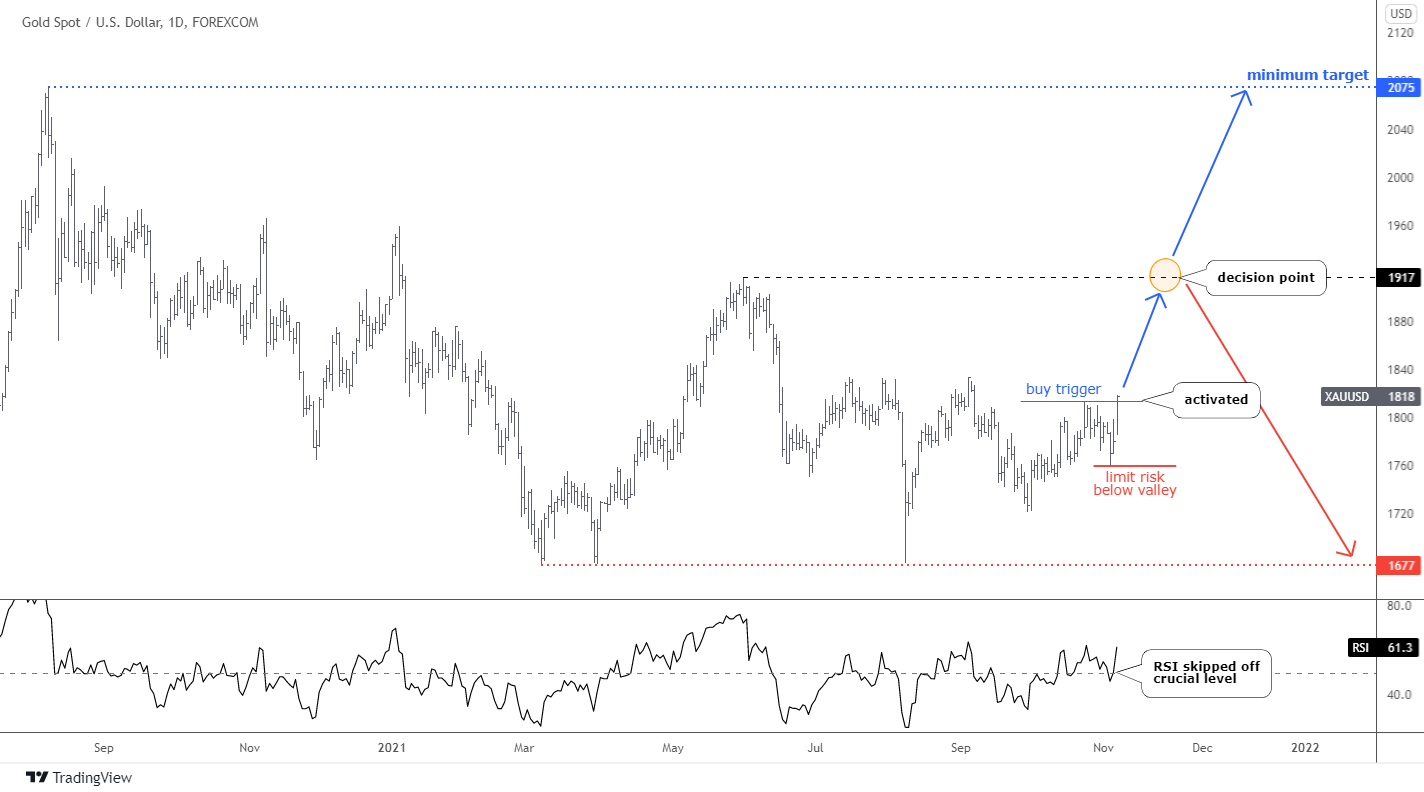
The year is approaching a sunset. It is the right time for precious metals to get ready for a Santa Claus visit to take them for a ride to the sky. One of the metals has already been in the game; I am talking about gold.

Daily Gold Chart

In October, I enriched the bullish view with the newly spotted “Diamond” reversal pattern. Most of you confirmed that you see this pattern. It is still good, as the invalidation level was not touched. Continue reading "Santa Claus Rally Kicks Off For Gold"

Bitcoin Triggered Buy Setup, Plus Gold And Silver

Bitcoin is a true modern hero in the financial world as it stands no matter what. Let it be the Chinese government's ban or US regulators and financial elite's rejection.

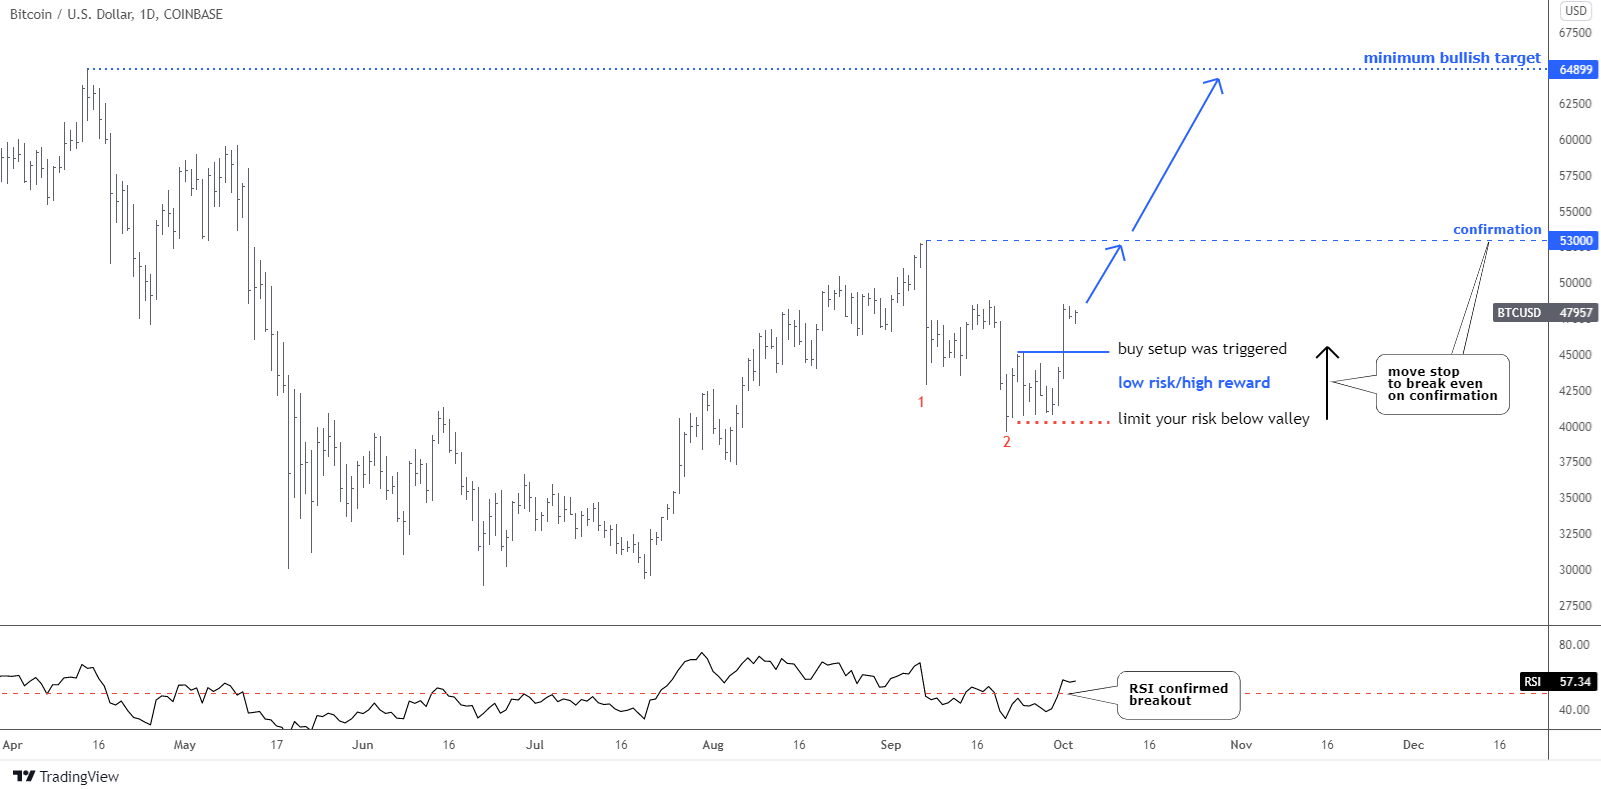
It is amazing how Bitcoin follows a conventional chart structure as it acts like matured instruments over time but at a higher speed. The predicted drop in leg 2 down hasn’t kept us long as it emerged the same day when the previous update was posted.

Most of you thought that this drop could be just a part of a pullback ahead of another Bitcoin rally.

Bitcoin Daily Chart

The collapse in red leg 2 down was close to hitting the preset target of $38k, as it bottomed at the $39,600 mark. The structure looks completed as it has met the minimum requirement to travel an equal distance with leg 1. Continue reading "Bitcoin Triggered Buy Setup, Plus Gold And Silver"

Platinum And Silver Update

One of our regular readers kindly requested the update of Platinum chart. Here we go as promised.

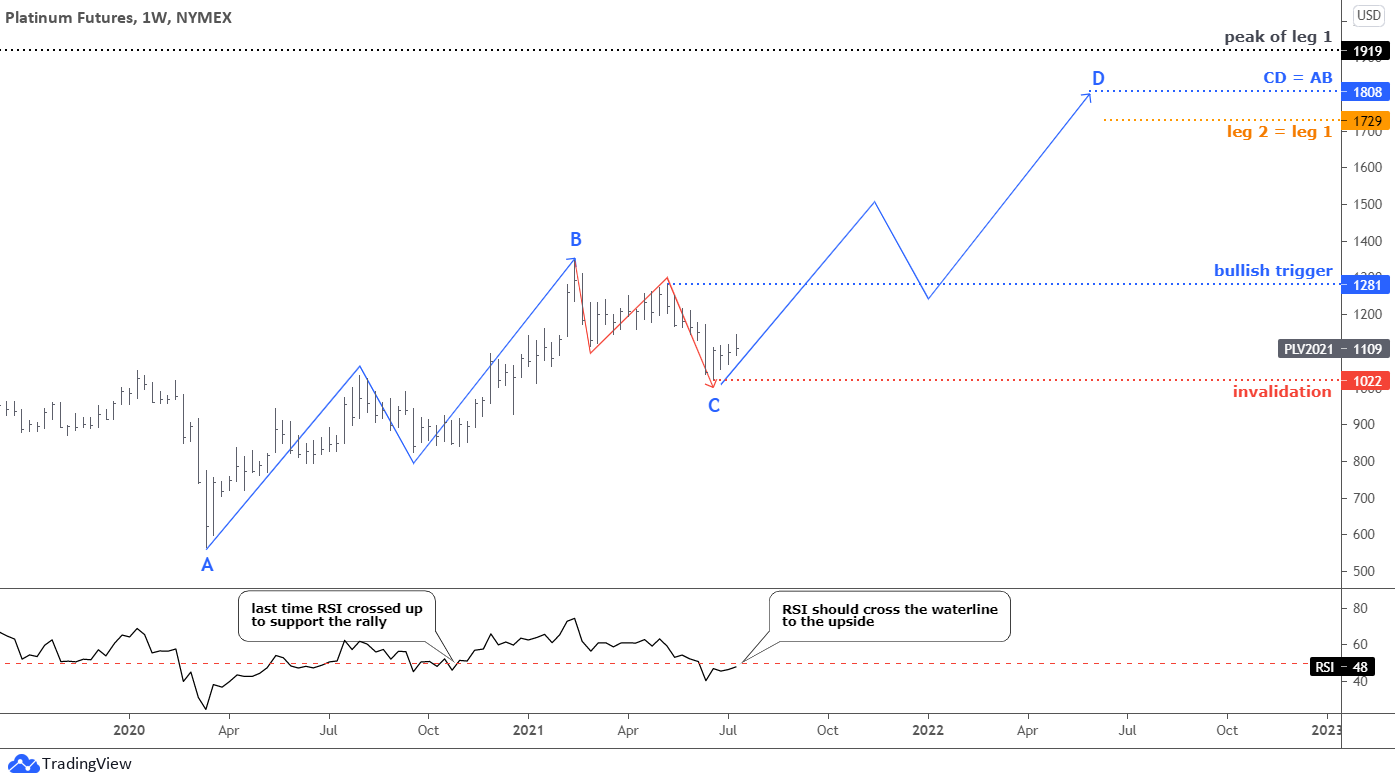
The global outlook for platinum posted in 2019 remains unchanged and you could see that big chart at this link. The previous update was this February as I used the cloning technique to visualize the current second leg up. Platinum futures prices did not follow it, therefore, below is the updated chart.

Weekly Platinum Chart

The leg 2 up had started with a two-leg zigzag up labeled as a blue AB part. It looks symmetric as both legs are almost equal and have the same trajectory. Then we can clearly distinguish the BC consolidation part, which consists of two legs down (red zigzag). It pierced the 38.2% Fibonacci retracement level to hit the valley of $1022. The RSI dropped slightly below the crucial 50 level. Continue reading "Platinum And Silver Update"