Dollar Struggles, Gold Consolidates; Oil To Triple Digits?

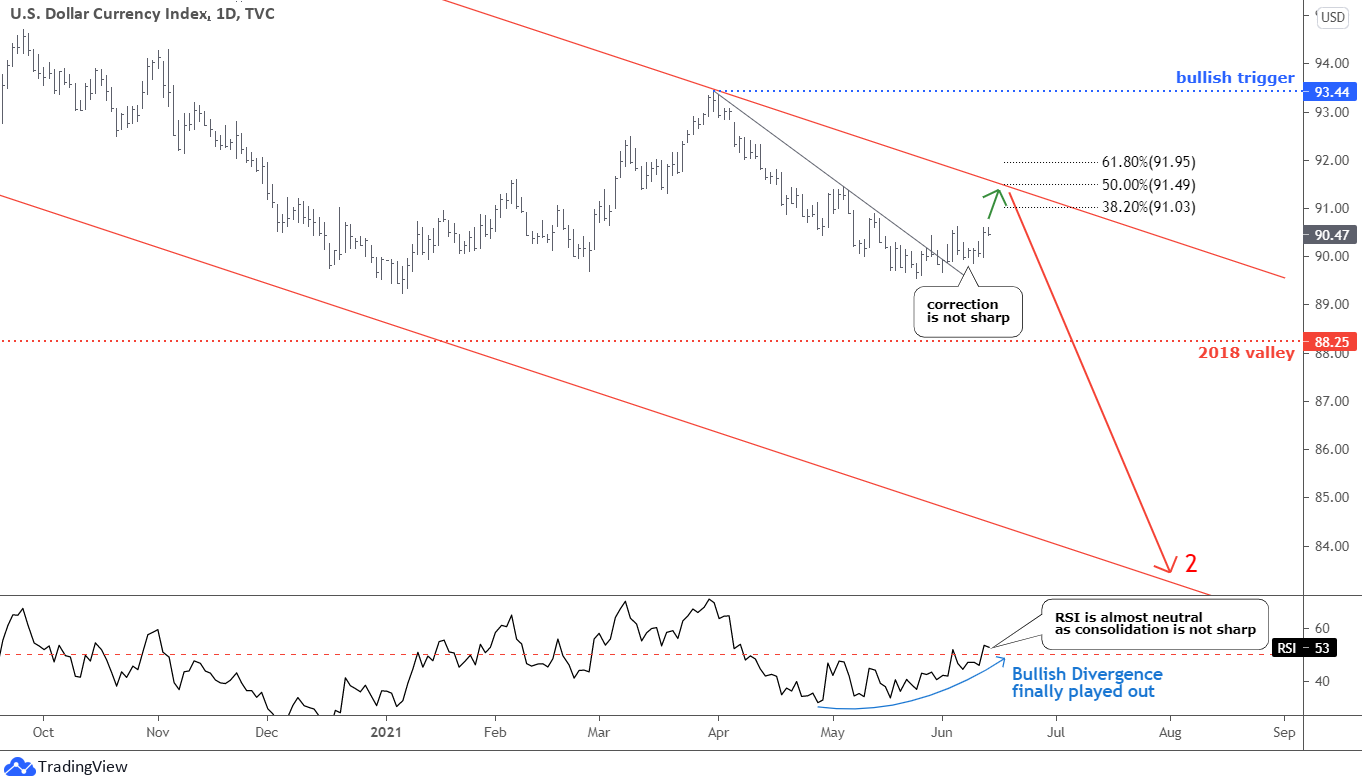
The U.S. dollar index (DXY) finally entered the anticipated corrective phase as I called for it last month.

US Dollar Index

The confirmation came with the breakup of a gray resistance. The structure is not as sharp as I expected as the price is still below the Fibonacci retracement zone. All spikes are still around the initial breakout peak, around 90.5. Continue reading "Dollar Struggles, Gold Consolidates; Oil To Triple Digits?"

Silver Favor Bulls; Bitcoin To Zero?

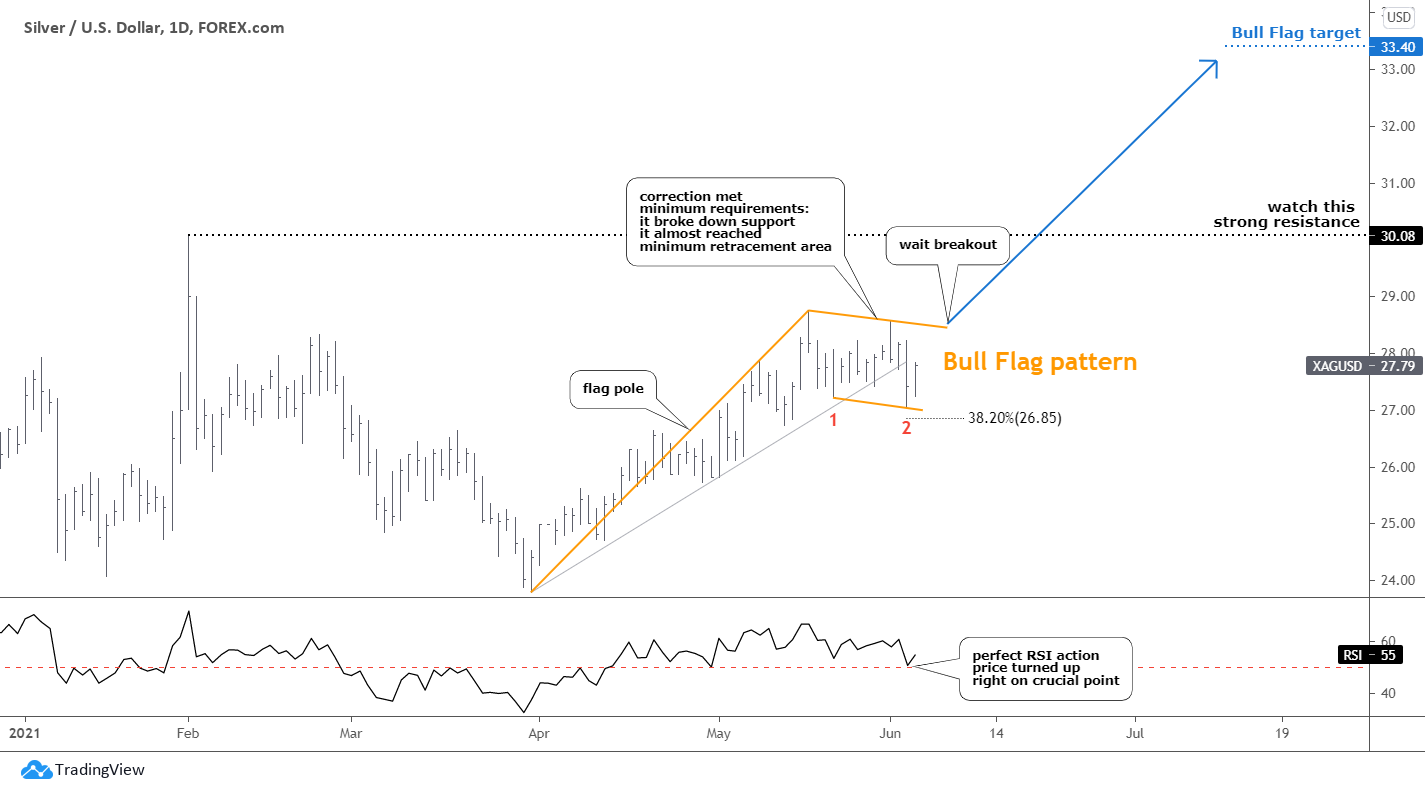
Let us start with the positive news; I spotted a hopeful sign in the silver chart. In my earlier update last month, I anticipated a correction to come in the dollar, gold, and silver charts.

Daily Silver Chart

The cleanest retracement among the assets mentioned above appeared in the silver chart as it met minimum requirements. Silver’s price broke below gray support, and the correction almost hit the 38.2% Fibonacci retracement level. It consists of two distinct legs down marked with red numbers. Continue reading "Silver Favor Bulls; Bitcoin To Zero?"

Dollar, Gold, And Silver Update

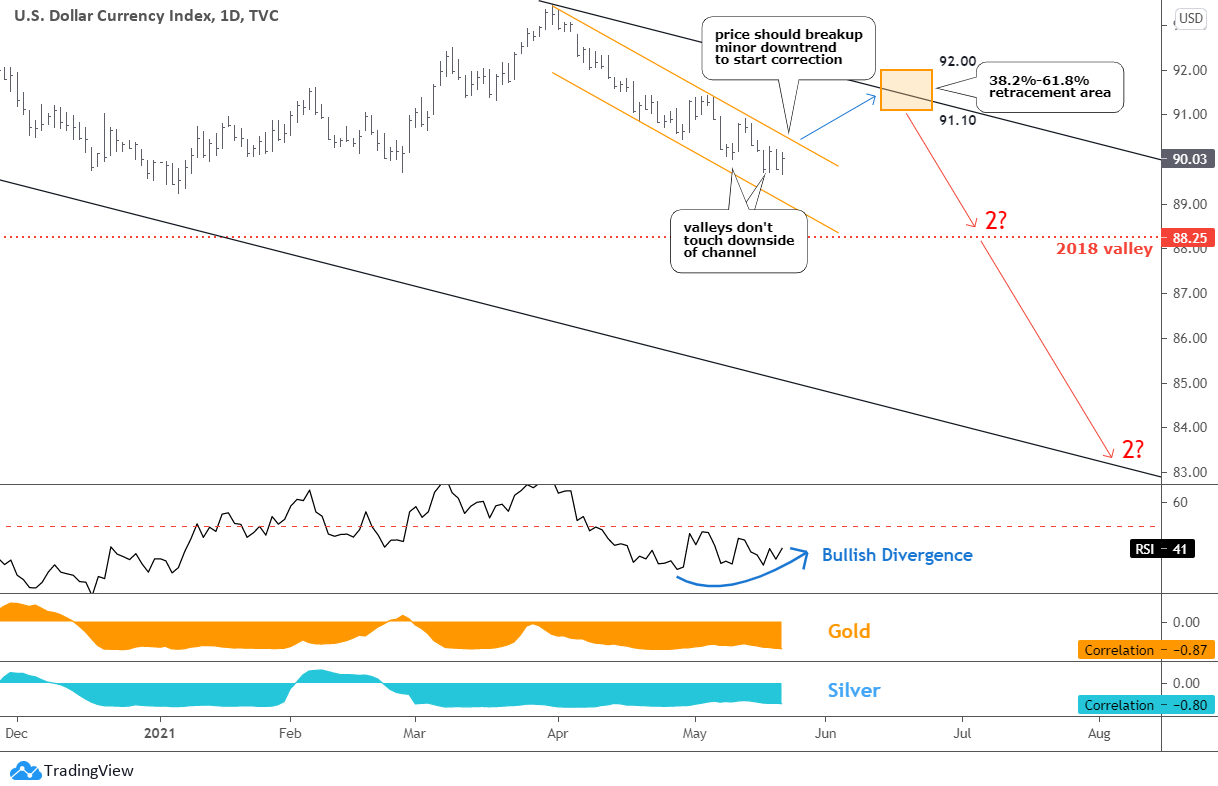
The U.S. dollar index (DXY) did not make a significant pullback despite my expectations posted earlier this month. The minor bounce was short-lived as the price quickly reversed all gains and updated the low after that.

Dollar, Gold, Silver Update: Daily US Dollar Chart

The downtrend is so strong that DXY could fit within a very narrow orange channel. However, I think we still need a visible correction to come, as new signals are alarming. Continue reading "Dollar, Gold, And Silver Update"

Bitcoin, Ethereum, And Ripple

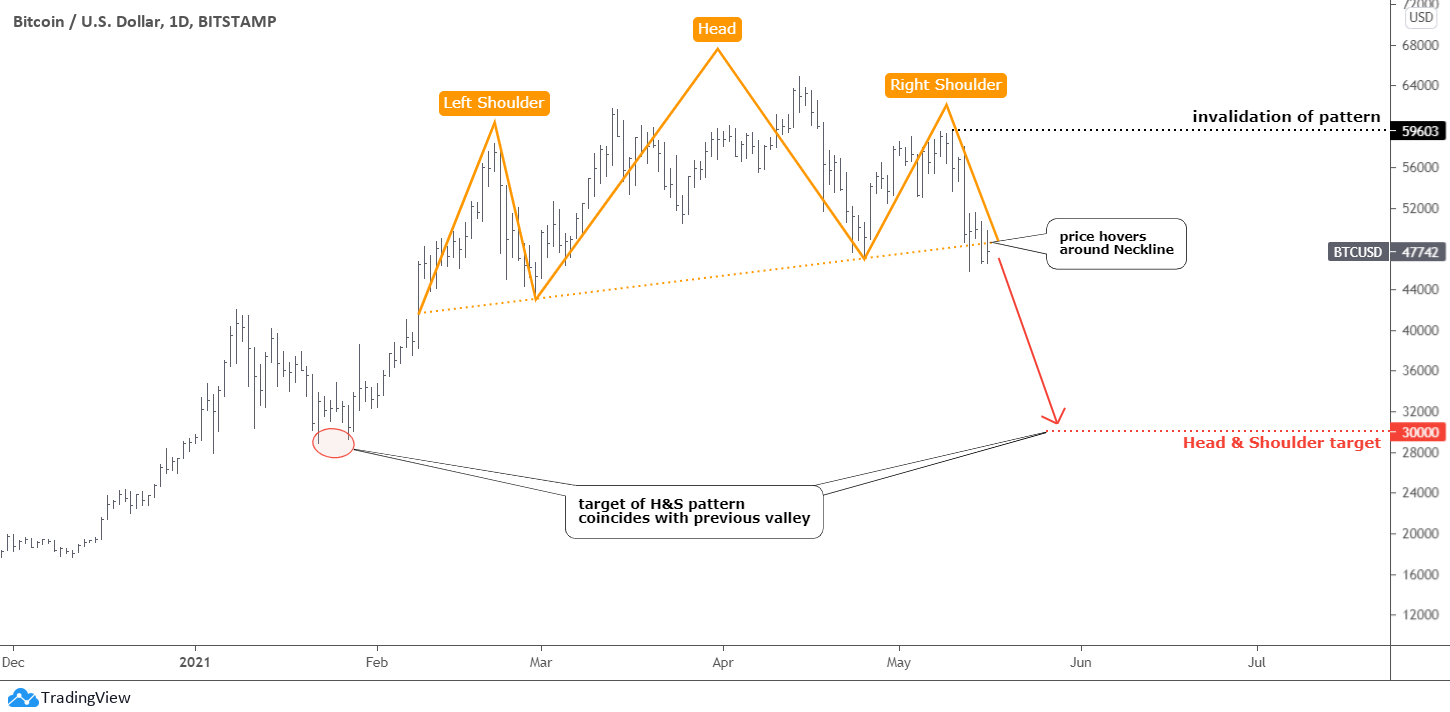
The bullish setup for Bitcoin that I discussed last week was not triggered, as the price did not break above the bullish confirmation level. The price went the opposite direction, falling beneath the invalidation trigger instead.

The key factors for the sell-off were the U.S. probe into the Binance crypto-exchange, and Tesla is reversing its stance on accepting Bitcoin. The green economy does not support Bitcoin due to its vast electricity consumption, which is generated primarily from fossil fuels.

Bitcoin Daily Chart

The combination of peaks in one area with the highest one in between has built the famous Head & Shoulders reversal pattern (orange). The main focus now is on the orange dotted Neckline as the price hovers around that support. A clear breakdown of it is needed for the pattern to play out. Continue reading "Bitcoin, Ethereum, And Ripple"

Bitcoin: Make It Or Break It

One of our readers requested the update on cryptos, including Ethereum, this week. Here we go.

The leading coin has taught us excellent lessons recently. I shared with you a bullish setup for Bitcoin a month ago. In the following update, I recommended to move the stop loss higher from $50k to $55k area to cut the risk after the breakout and increase the risk/reward ratio to sound 2.7.

The price indeed broke above the confirmation level of $61782 and quickly reached the new all-time high in the $65k area, but then it failed to advance.
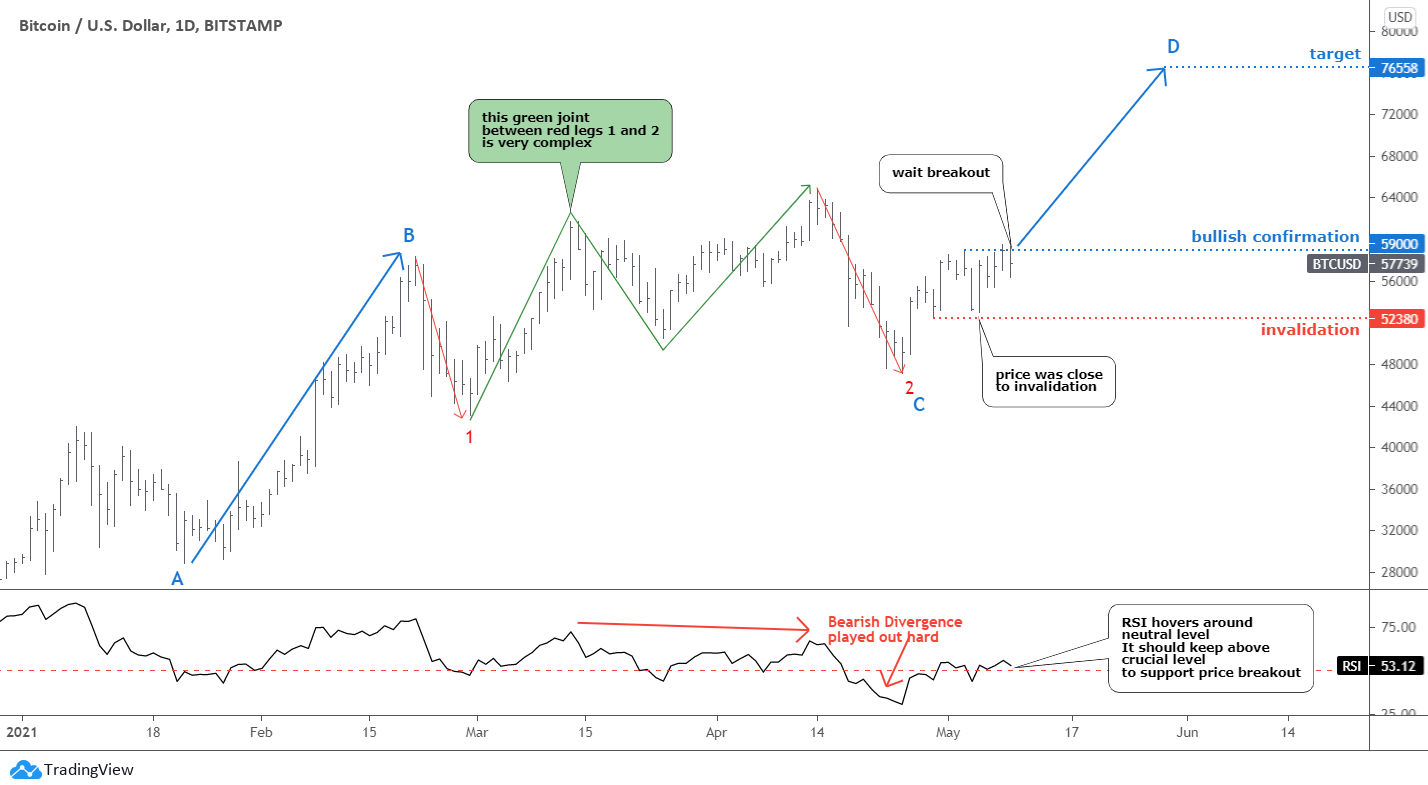
Bitcoin

We have the first lesson here from the RSI. As we can see on the sub-chart, the indicator did not confirm the new all-time high as it established a lower peak instead. This built the Bearish Divergence then, and the outcome you already know, the price collapsed dramatically. Continue reading "Bitcoin: Make It Or Break It"