Options Trading - Custom Put Spreads

Leveraging a minimal amount of capital, mitigating risk, and maximizing returns is the objective of an options-based portfolio. Options trading can offer the optimal balance between risk and reward while providing a margin of downside protection with a high probability of success. Proper portfolio construction and optimal risk management are essential when engaging in options trading as a means to drive portfolio performance. Key pillars of risk mitigation are rooted in maintaining liquidity, risk-defining trades, staggering options expiration dates, trading across a wide array of uncorrelated tickers, maximizing the number of trades, appropriate position allocation, and selling options to collect premium income. Customizing your option trade structure is another element that can be layered into the overall strategy for long-term success in options trading. A risk-defined custom put spread offers layers of protection, thus optimizing the risk management aspect of an options trade while maximizing return on investment.

Custom Put Spreads: Results

Leveraging a minimal amount of capital and maximizing returns with risk-defined trades optimizes the risk-reward profile. Whether you have a small account or a large account, a defined risk (i.e., custom put spreads) strategy enables you to leverage a minimal amount of capital which opens the door to trading virtually any stock on the market regardless of share price such as Apple (AAPL), Amazon (AMZN), Chipotle (CMG), Facebook (FB), etc. Risk-defined options can easily yield double-digit realized gains over the course of a typical one month contract (Figures 1, 2, and 3).

Options Trading
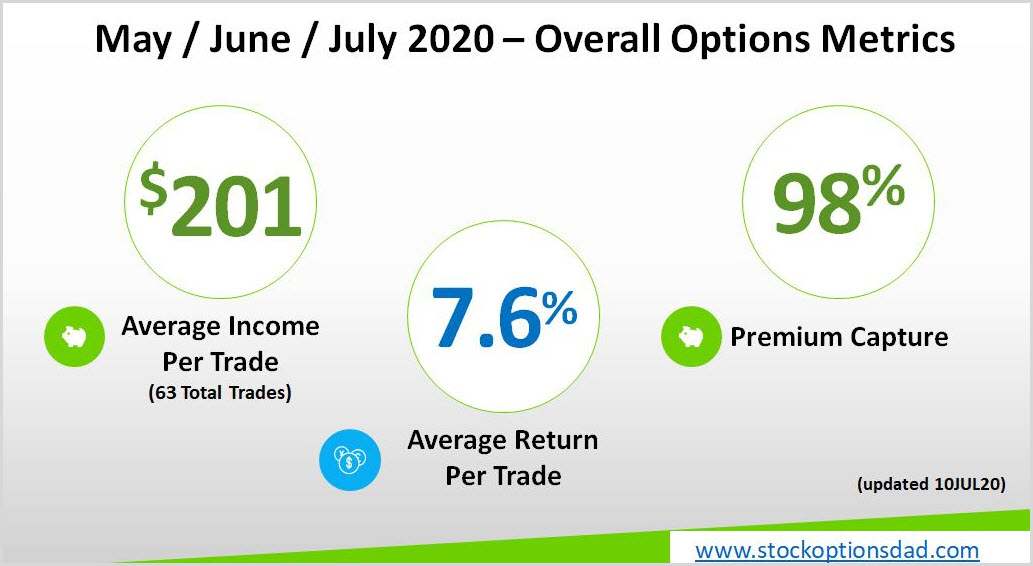
Figure 1 – Average income per trade of $201, the average return per trade of 7.6% and 98% premium capture over 63 trades in May and June
Continue reading "Options Trading - Custom Put Spreads"

Gold And Silver Could Diverge

At the beginning of this month, I shared a warning alert as the silver chart had a Bearish divergence. The trigger was set below 50 on the RSI. It wasn’t activated, and gold and silver moved higher. Moreover, silver finally hits the target. The majority of readers kept a bullish outlook and got it right.

I prepared an update for you with the bonus chart at the end, so stay tuned.

Let’s start with the daily gold chart.

Gold Chart

Gold is slowly moving to the upside. It hasn’t shown any bearish signs as of yet. The metal finally elevated above the top of the preceding large consolidation beyond $1766 (black dashed line), eliminating the option of another leg down within an even more extended consolidation. Continue reading "Gold And Silver Could Diverge"

Silver Futures Hit New 10-Month High

Silver Futures

Silver futures in the September contract settled last Friday in New York at 19.05 an ounce while currently trading at 19.75 up $0.70 for the trading week as prices have now hit a 10-month high. The US dollar is lower by 35 points today, breaking the 96 level as that is a fundamental bullish factor towards the precious metals, including silver, as I think prices will break the $20 level come next week.

I have been recommending a bullish position over the last month from around the 18.61 level. If you took that trade continue to place the stop loss under the 10-day low standing at 18.23, however, in next week's trade, the stop loss will be tightened significantly, therefore lowering the monetary risk.

Silver prices are trading far above their 20 and 100-day moving average as the trend is strong to the upside as gold prices are right at a 9-year high. I also have a bullish recommendation in platinum, as the entire sector is in the midst of a solid trend to the upside. If prices crack the $20 level, look for the volatility to expand tremendously as the price swings will have a large percentage move daily. I still think we can head up to the $25/$30 level.

TREND: HIGHER
CHART STRUCTURE: IMPROVING
VOLATILITY: HIGH

Natural Gas Futures

Natural gas futures in the September contract settled last Friday in New York at 1.85 while currently trading at 1.78 down slightly for the trading week as prices are still near a multi-decade low. Prices topped out recently on June 7th around the 1.99 level while bottoming out on June 26th at 1.58 basically right in the middle part of that range looking for a fresh trend to the upside to develop, in my opinion. Continue reading "Silver Futures Hit New 10-Month High"

The Big Picture Continuum

The Continuum (monthly 30yr yield with the 100-month EMA ‘limiter’) simply states that the economy was weakening, as were inflation expectations, before 2020. In early 2020 we got a real deflationary jolt from which asset markets are still clawing back, with full frontal inflationary support from a Federal Reserve desperate to keep asset owners whole (and further enriched) and to further punish savers and those without the means to invest in the racket.

They called Ben Bernanke “the Hero” but he was actually the perpetrator of the next debt-backed inflation that would further ruin the country, primarily by greatly increasing the divide between asset owners and everyone else. If we had taken the pain in 2008 and 2009 we’d be on a new system now. Instead, we are riding the Greenspan>Bernanke>Powell continuum. Yellen is omitted because nothing egregious happened under her watch. She slipped in between the cycles and fell through the cracks.

Racism? Scapegoating? Xenophobia? Paranoia? Polarization? Caricature of the truth and of the debate? It’s all in there and it’s all in one way or another compliments of the rigged monetary system promoted by the Fed and whatever party happens to be in power at any given time (let’s remember that Bernanke’s ‘rich richer, poor poorer’ scheme was cooked up under a supposed socialist president). The public is filled with political bias and hatred but is relatively ignorant about where the wheels of injustice actually turn. Continue reading "The Big Picture Continuum"

Why It's Different This Time

The other day I completed a survey for my brokerage company, and one of the questions they asked was, "Is the current crisis worse than the 2008 financial crisis?" A couple of months ago, when our state and region were mostly in lockdown, I would have answered with a resounding and unhesitating, "Yes!"

Now I'm not so sure. Admittedly, I don't live in one of those states where the virus is now spiking, and things here are close to back to normal, so maybe my vantage point is too subjective. Nevertheless, I would have to say this crisis is far from as bad as the previous one, which may explain why the stock market has behaved the way it has, namely prices are off only a little from where they began the crisis, with only that short, sharp drop in February and March.

One reason, of course, is that the economy, as a whole, has rebounded strongly over the past couple of months as most of the country has reopened, at least to some degree, even as millions of people continue to work remotely. But the main reason is that that the lessons we learned from 2008 have been brought to bear in this crisis, namely that the government and the Federal Reserve have thrown much more money and resources at the problem than they did 12 years ago, which has mitigated the damage to a great degree.

As we've seen in the second-quarter earnings reports released so far by the big banks, the measures taken after 2008 to make sure they've built up enough capital to withstand another global crisis have paid off. Other than Wells Fargo (WFC) – which is still in the Fed penalty box, forbidden to grow assets – which reported a big loss, the other big banks reported flat Goldman Sachs (GS) or reduced JPMorgan Chase (JPM), Citigroup (C), and Bank of America (BAC) earnings compared to a year ago. It could have been a lot worse. Who would have thought they'd be able to pull that off three or four months ago? Let's give the Dodd-Frank Act and Fed capital requirements the props they deserve. Continue reading "Why It's Different This Time"