Platinum Cleared The "Launch Pad" For Palladium

In a previous post titled "Platinum Outshines Palladium, Yet Both Offer Opportunity," I discussed potential opportunities for investors to buy into these two white metals.

The fact that platinum was chosen over palladium by three out of five readers in the ballot was not surprising. The platinum/palladium ratio and the chart setup for platinum futures were both supportive of the title's argument.

Let’s check on what has changed in one month. We'll start with platinum futures.
Platinum Futures Daily

Source: TradingView

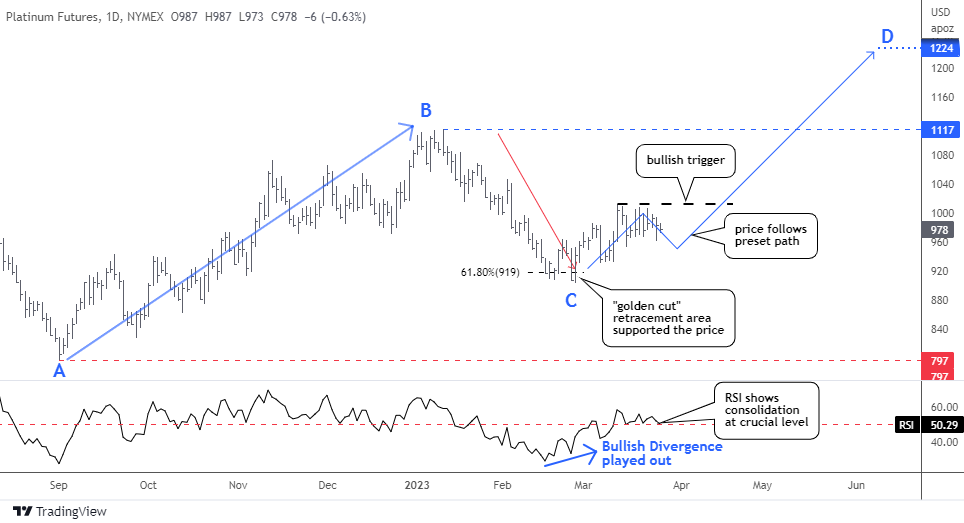
The price of platinum futures has been following my predetermined path with remarkable accuracy. I kept the previous annotations for you to see it.

The forecast that the price would reverse around the "golden cut" 61.8% Fibonacci retracement area proved to be successful, as the price tested the support twice and held. Subsequently, the futures price mimicked the trajectory of the blue zigzag, moving to the upside. Continue reading "Platinum Cleared The "Launch Pad" For Palladium"

Was The Collapse of SVB a Black Swan?

According to some doomsayers, the stock market is on the brink of a crash, and the collapse of Silicon Valley Bank (SVB) is being considered as a potential "Black Swan" event.

They believe it could trigger a domino effect similar to the Lehman Brothers collapse in 2008. There are already indications of this, as the failure of SVB has had a ripple effect in Europe, with the second largest Swiss bank, Credit Suisse, also being hit.

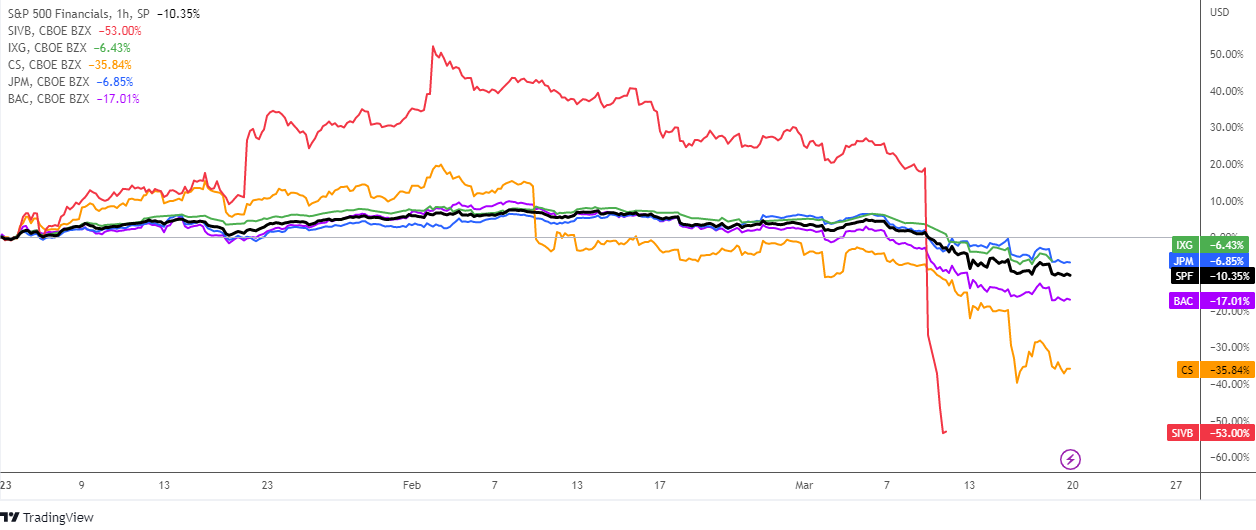
YTD SPF IXG SIVB JPM BAC CS

Source: TradingView

In the comparative chart above there is a year-to-date dynamics of S&P 500 Financials index (SPF, black), the iShares Global Financials ETF (IXG, green), SVB Financial Group (SIVB, red), Credit Suisse (CS, orange), JPMorgan Chase (JPM, blue) and Bank of America (BAC, purple).

On the chart, all of the lines indicate negative performance, with each one below the zero mark. Indeed, SVB and CS are the ultimate losers, while BAC is also suffering a significant loss at -17.01%. Meanwhile, IXG, JPM, and SPF fared slightly better, with losses of -6.43%, -6.85%, and -10.35%, respectively.

This indicates that banking stocks around the world are losing ground following the trigger from SVB, as seen with the decline in IXG and the top two banks in the US. Continue reading "Was The Collapse of SVB a Black Swan?"

Gold Update: Is Half Enough?

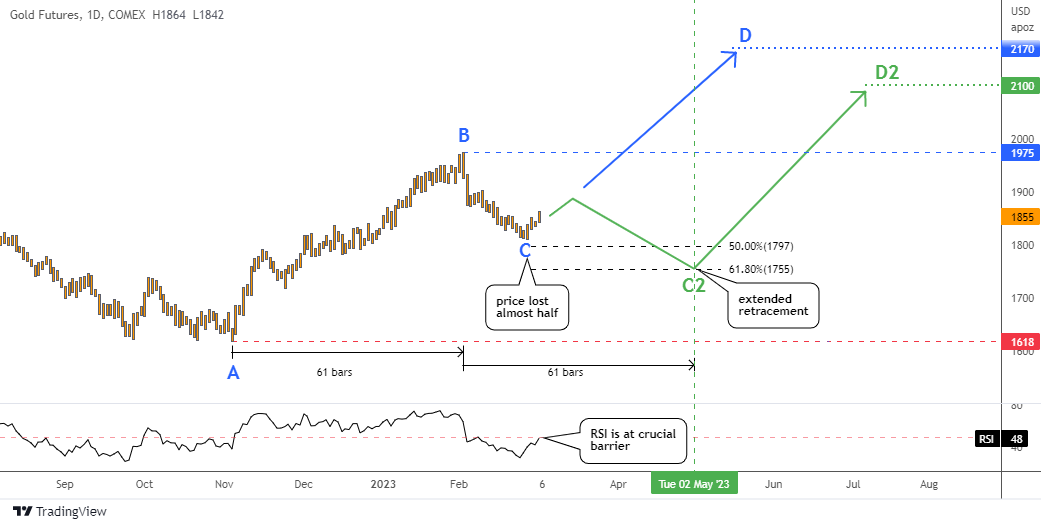
Since my last major update in November, the gold futures price has increased by almost 12%. At that time, most readers had chosen the bullish target of $2,089, where the price would retest the all-time high.

The gold futures chart is due for an update as it has reached a significant point in the current retracement following its recent peak at $1,975.

Gold Futures Daily

Source: TradingView

The gold futures price had been steadily rising for three months from the start of November until the beginning of February, where it reached a top of $1,975.

However, the market was hit when the “Jobs Report Dropped A Bombshell On The Markets”, which caused a significant drop in the value of many assets, including gold.

The recent price action in gold futures has been notable, marked by a sudden drop of $100 at the beginning followed by a slower decline in pace as the price retraced almost 50% and hit $1,811 by the end of February.

The question is whether this loss of half of the preceding rally is enough to consider the current bounce as a reversal. Continue reading "Gold Update: Is Half Enough?"

Alert In Two Major Cryptocurrencies

It is time to update the crypto charts as I spotted a strong alert in two major coins for you.

It is ironic that the signal comes from the same indicator that accurately predicted the rally of Bitcoin last November when the price was around $16k.

Bitcoin Daily

Source: TradingView

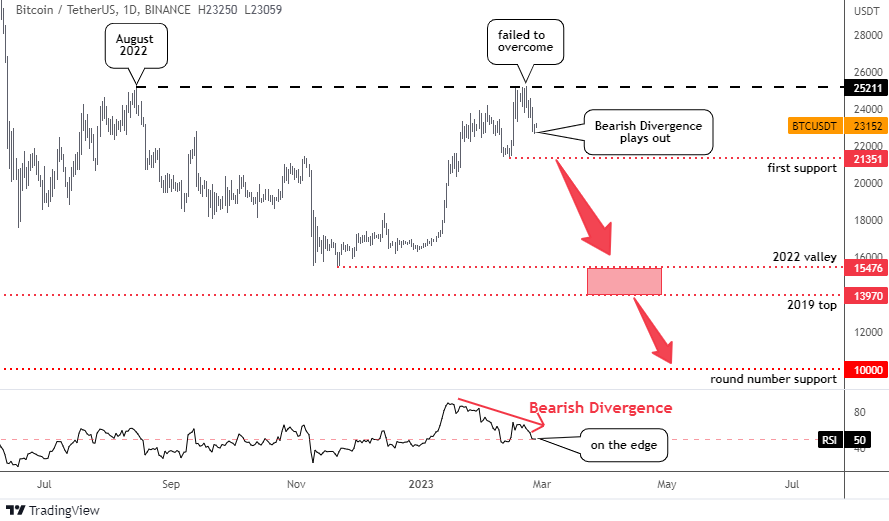
Indeed, the main coin has rallied for whopping 52% after the signal topping slightly above $25k. The previous peak of August 2022 at this level unexpectedly acted as a strong barrier that the price couldn’t overcome.

In my recent update last month I warned that “the bullish impulse should not fade until it touches the moving average around $27k to convince the trading community”.

Unfortunately for bulls, the rally has faded below the target. However, the majority of readers did not see this rally as a sign of a global market reversal.

This time, the same RSI indicator doesn’t confirm the most recent peak on the price chart as it shows a lower top. This is called a Bearish Divergence. Continue reading "Alert In Two Major Cryptocurrencies"

Platinum Outshines Palladium, Yet Both Offer Opportunity

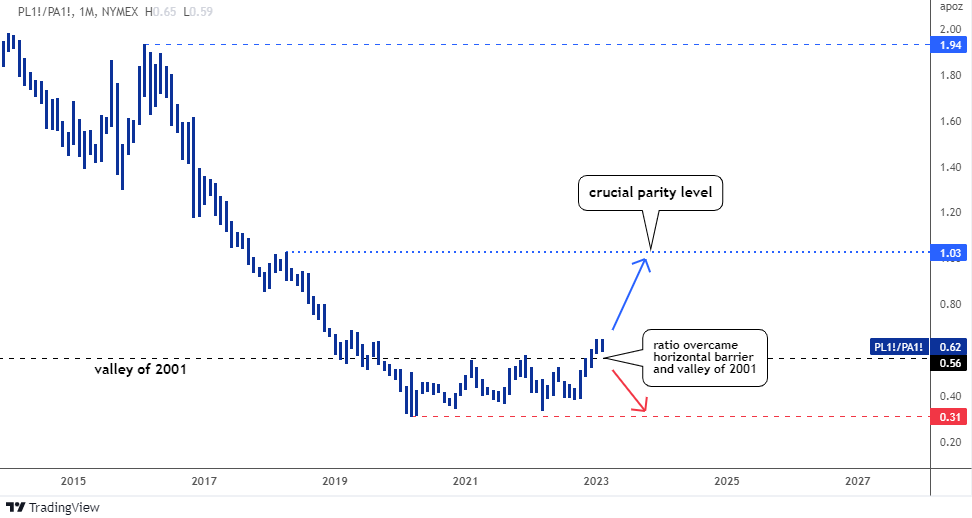
Almost four years ago, I wrote about the supremacy of palladium over platinum, and we watched the Platinum/Palladium ratio fall below its long-term valley of 0.56 oz.

In contrast, today the Platinum/Palladium ratio is approaching a 4-year high of 0.7 oz, marking a doubling from its all-time low of 0.31 oz established in 2020.

Platinum-Palladium Ratio Monthly

Source: TradingView

On its way up, the ratio broke through a double barrier that included the 2001 valley of 0.56 oz and the horizontal resistance at the top of the range. There are no other barriers for the ratio until it reaches parity between the two metals, which will be a crucial resistance level.

This is because palladium was replaced with the cheaper platinum in the automobile industry due to palladium's abnormally expensive price.

It is estimated that the platinum substitution of palladium reached 340 koz in 2022, and it is predicted to increase to over 500 koz in 2023, more than twice the amount in 2021. Continue reading "Platinum Outshines Palladium, Yet Both Offer Opportunity"