Does Oil Hold The Key To The Canadian Dollar

Aibek Burabayev - INO.com Contributor - Metals - Canadian Dollar


At the end of last month, I called for a substantial upcoming weakness in crude oil as the market could have finished the long-lasting consolidation after the earlier crash from 100+ levels. Indeed, oil lost almost $4 from that time and now is rebounding as markets naturally move in zigzags.

Oil-related currencies also suffer, and in this post, I would like to share with you an exciting chart setup with tremendous profit potential for one of such currency, the Canadian Dollar (CAD) also known as “Loonie” among traders.

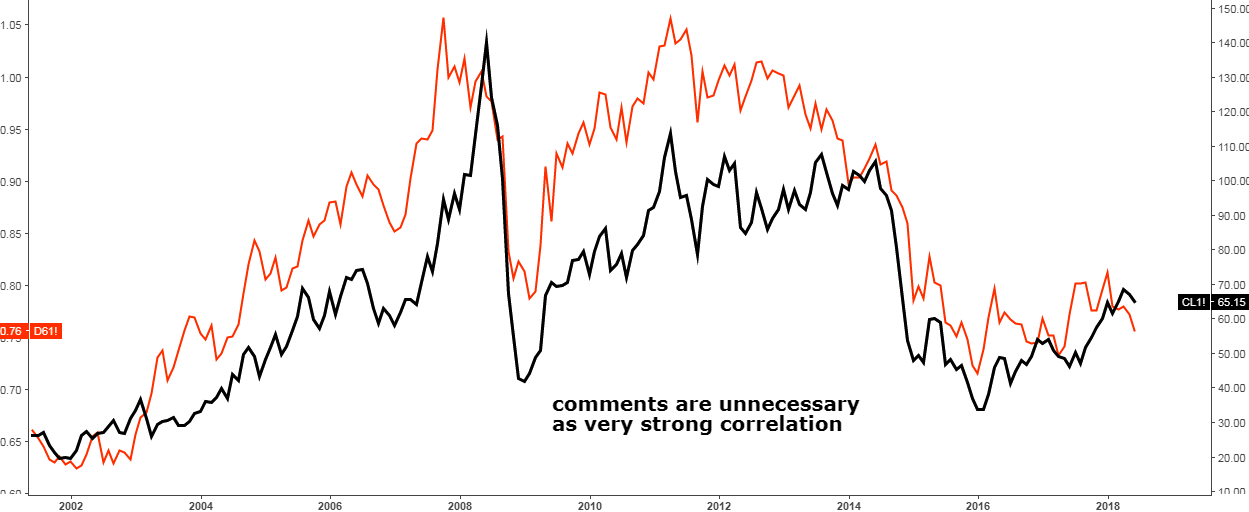
Before that, I built a chart to demonstrate the correlation between WTI crude oil and the Canadian Dollar.

Chart 1. WTI futures Vs. Canadian dollar futures: Perfect Correlation
Canadian Dollar
Chart courtesy of tradingview.com

In the chart above the WTI futures graph is black on the right scale and the Canadian Dollar futures graph (in US$ per 1 CAD) is red on the left scale. I didn’t add any annotations on the chart as you can clearly see that the correlation is just perfect and the most important fact is that the crucial market phases like strong moves and consolidations coincide in time. The Canadian Dollar tends to overshoot WTI amid market strength, but it is quite moderate during market weakness. Continue reading "Does Oil Hold The Key To The Canadian Dollar"

Commodities: Sell In May And Go Away?

Aibek Burabayev - INO.com Contributor - Metals - Sell In May And Go Away


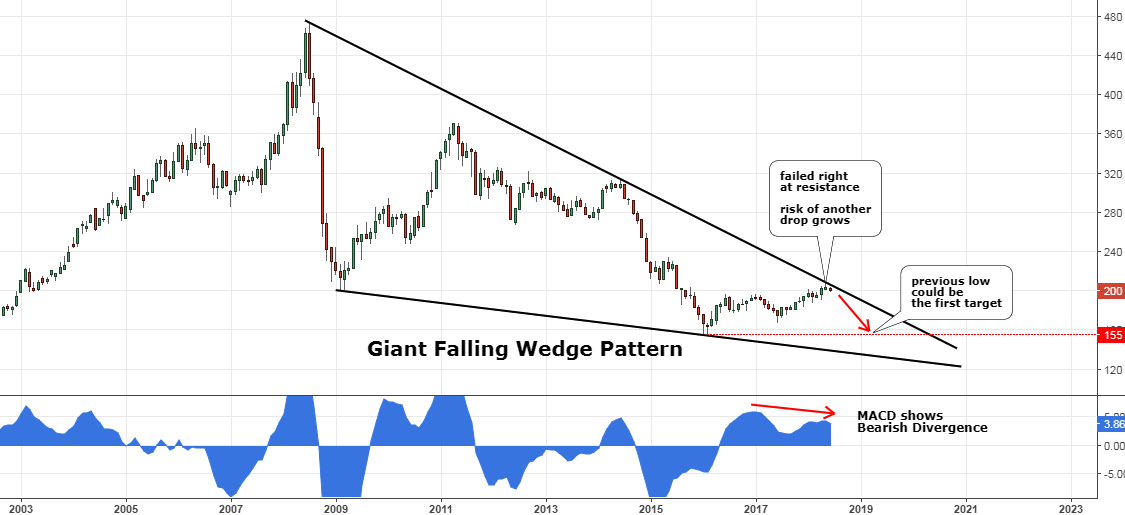
Last August I posted a chart analysis of one particular commodity market index as I spotted an interesting pattern. As time goes by, we can see how my outlook emerged and after almost a year the market reached another crucial milestone or better yet a decision point.

This index is called The Thomson Reuters/CoreCommodity CRB Index (CRB). It is the gauge of the commodities market, which is comprised of 19 commodities: Aluminum, Cocoa, Coffee, Copper, Corn, Cotton, Crude Oil, Gold, Heating Oil, Lean Hogs, Live Cattle, Natural Gas, Nickel, Orange Juice, Silver, Soybeans, Sugar, Unleaded Gas, and Wheat.

So, if you watch commodities market, then the two charts below could be of strong interest to you.

Chart 1. Thomson Reuters/Jefferies CRB Index Monthly: Failed At Resistance

Sell In May And Go Away
Chart courtesy of tradingview.com

Above is an update of the earlier chart. The risk/reward that time ($182) favored a long position as the upside target at the major top ($474) promised to cover risk extensively amid oversold market conditions. Continue reading "Commodities: Sell In May And Go Away?"

Stock Analysis From A To Z: Letter "C"

Aibek Burabayev - INO.com Contributor - Metals


There is not much change in the precious metals charts, and that gave me a chance to find some trading setups for stocks. In this post, I would like to share my analysis of the stocks starting with the letter “C.”

Table 1. Filtered Stocks For Letter “C”

Letter C stocks
Chart courtesy of finviz.com

Out of the 19 screened stocks I’ve selected three to analyze as they have clearer chart structure: CAVM, CNK, and CPE. All of them have potentially good short setups. It looks like not all companies could keep the pace with the rising S&P 500 index which continues to make record highs one after the other. Continue reading "Stock Analysis From A To Z: Letter "C""

Stock Analysis From A To Z: Letter "B"

Aibek Burabayev - INO.com Contributor - Metals


In this post I would like to share with you the analysis of the stocks with a name starting with letter “B”. There are more stocks to choose from this time, according to the earlier mentioned filter criteria. Four stocks were shortlisted this time as they have clearer chart structure, but only two stocks reached the “well done” level. I witnessed again and again that U.S. stock market offers a lot of opportunities for investors and traders.

Below is the long list for letter “B”.

Table 1. Selected stocks for letter B

Table 1. Selected stocks for letter B
Image courtesy of finviz.com

Out of 24 filtered stocks I picked only four as they have clear chart structure: BBBY, BGCP, BWA and BYD. BBBY is oversold and has the potential for the long trade setup, but one should wait for the breakout of the multi-month downtrend, and try not to guess the bottom, which is always risky. Others have potential short trade setups. BYD, like BBBY is also not ready and continues upside. As I told you many times before, we shouldn’t be biased. I am neither a Permabear nor a Permabull, however only short setups have appeared recently on the chart radar. Continue reading "Stock Analysis From A To Z: Letter "B""

Stock Analysis From A To Z: Starting With The Letter "A"

Aibek Burabayev - INO.com Contributor - Metals


Earlier in the year, I had asked you to post things that you would be interested in me analyzing, and to my amazement, many of you asked for stocks. While that is outside my normal scope of the markets, I believe that my technical analysis could prove beneficial. So, with that in mind, I will start to share some technical analysis of U.S. stocks.

To keep it interesting, I plan on cycling through the stock market in alphabetical order using the criteria below.

Of course, I will continue to analyze the precious metals market, and that will still be my primary focus. Continue reading "Stock Analysis From A To Z: Starting With The Letter "A""