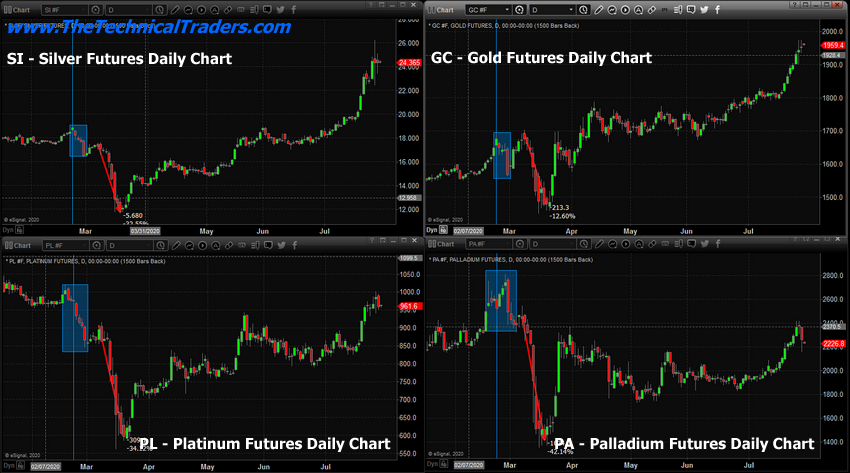
When I see such situations in the market as we witnessed in precious metals lately, I think about two trading mantras. The first one says, “any profit is a profit,” aka “lose chances, not money,” and the second is “corrections are tricky.”
Both metals’ charts started to play out precisely as per the structure that was shown in my previous update, and I am very grateful as you supported my view with an overwhelming majority of voters. Indeed, it paid well, although the depth of the first leg down was just devastating as it exceeded the preset range.
Usually, the first legs are so strong and sudden as they trigger panic in the market. Although I expected this move weeks ahead, when it plays out, you’re never emotionally ready for such a storm as it literally could have no boundaries. The fear had it all. Some traders think they could sit through such enormous volatility. I doubt that risk management/capital/margin could allow it as gold lost more than 10% from the top to the bottom of the first leg while silver has been smashed, losing 22%.
The dust is quietly settling down after that fall, and we can adjust the plan. Let’s start with gold’s daily chart.

Chart courtesy of tradingview.com
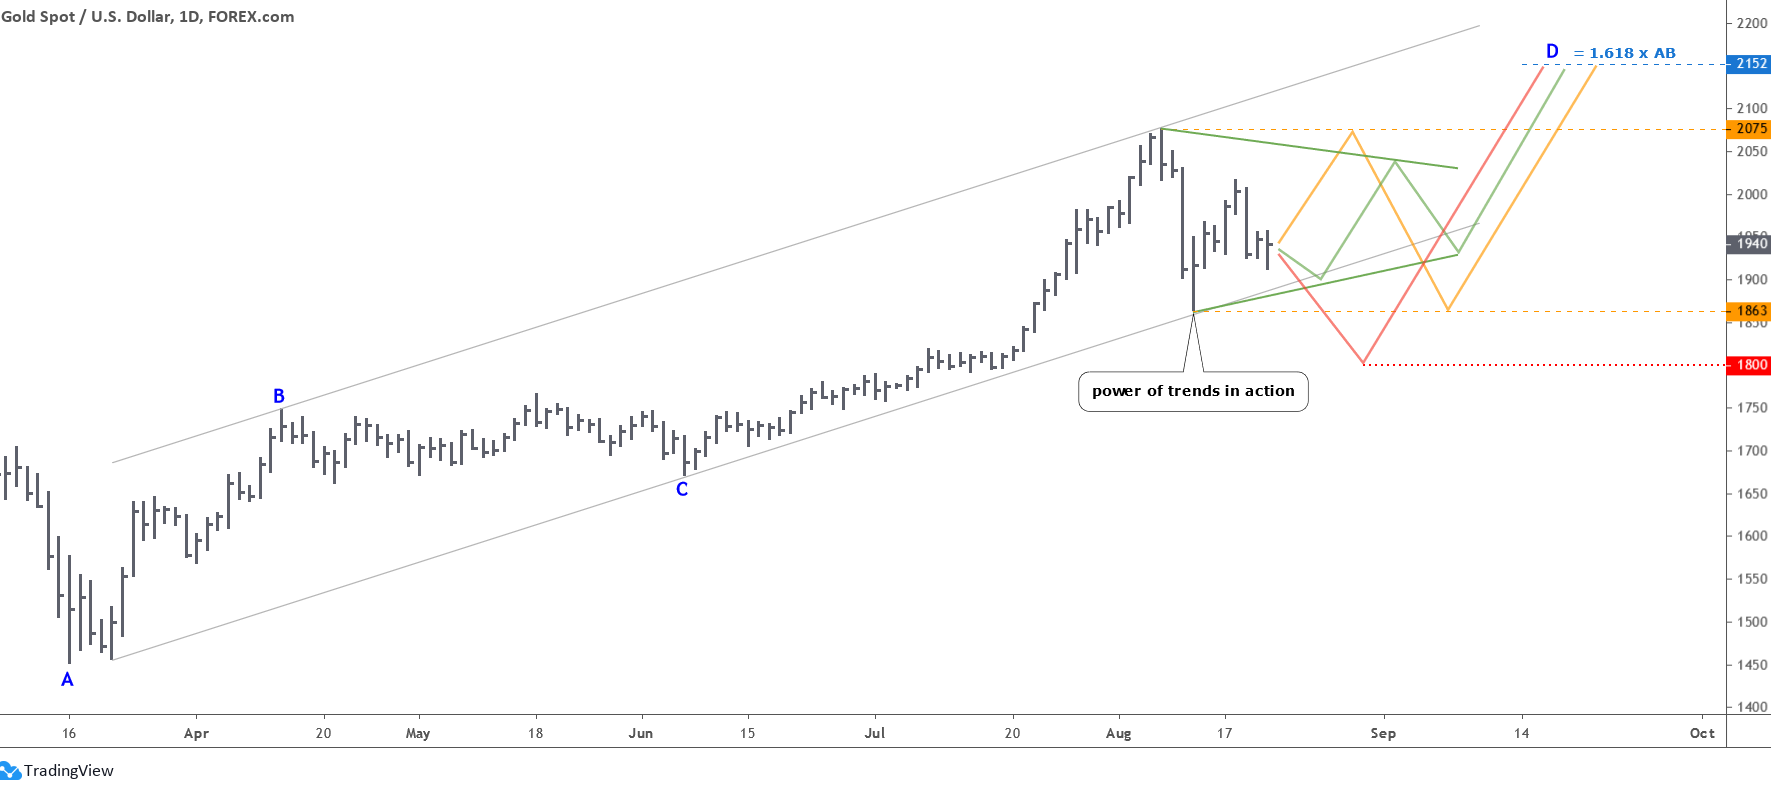
Again and again, we witness the real power of the trends as the “falling knife” of the first leg down was successfully rejected with the downside of the trend channel (gray). The price bounced off so hard that it retraced more than 60 percent of the preceding drop. Then it lost more than 60 percent again, but of the rise. If it continues to make such seesaw moves within a contracting range, then we will see a Triangle pattern shaping on the chart. I highlighted that option with a green color. I put two converging trendlines with almost ideal angles of a triangle, but the real path could differ, although the model should remain intact. The break above the last peak will trigger the upside move. Continue reading "Precious Metals: Where Do They Go From Here?" →


