Gold Builds Buy Setup, Is Bitcoin Next?

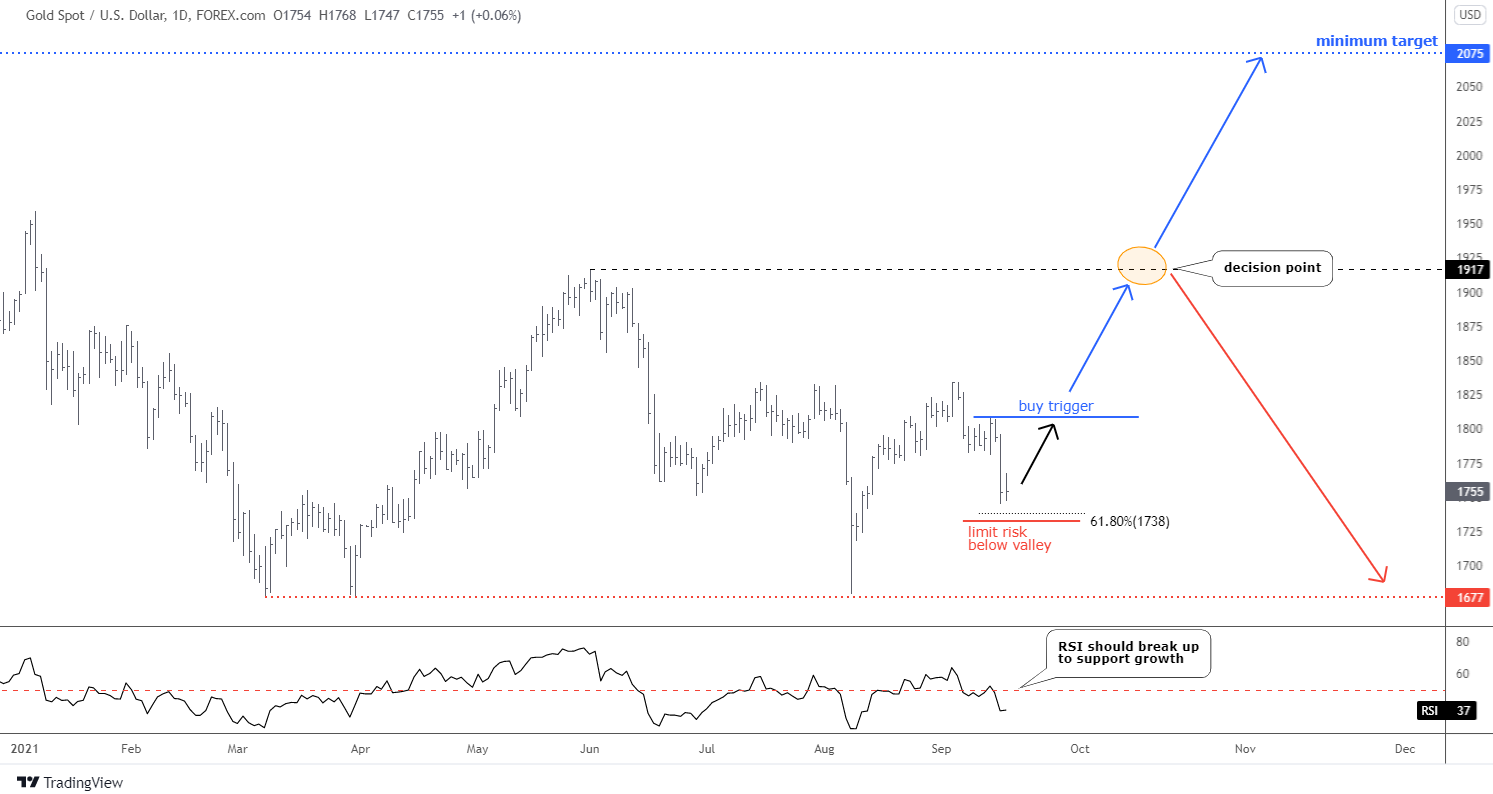
Gold follows the map posted in an earlier update.

Daily Gold Chart

Gold dropped within two visible legs close to the area of 61.8% Fibonacci retracement level located at $1,738. The second leg down has overshot the size of the first leg reaching almost 1.272 of its distance. The RSI has shown two legs down either. Initially, the 50 level in the indicator’s sub-chart acted as a support, and then it turned resistance for the joint between two legs. Continue reading "Gold Builds Buy Setup, Is Bitcoin Next?"

Gold Gets Hammered But Copper Fails To Seize The Moment

The Copper/Gold ratio remains at a key decision point. Gold has been clobbered lately but a key metallic macro indicator remains in a long-term congestion zone. If it’s going to be cyclical ‘inflation ON’ we’d expect Cu/Au to break through and do what it has not done since a major inflation trade blew out in 2006-2008, and for the 30yr Treasury yield to eventually catch on and rise at least to the EMA 100 (blue line).

copper/gold ratio & 30 year treasury yield

Here is the daily futures view of Cu/Au. Going by simple TA (daily trends) it looks poised to break out to the upside, especially in the face of a government at the ready to pump Trillions more funny munny into the economy. The economically cyclical metal would benefit over the more counter-cyclical monetary metal. It’s logical, but still theoretical. Markets do not always do the logical thing, now do they? Continue reading "Gold Gets Hammered But Copper Fails To Seize The Moment"

S&P 500 To Lose 30%?

It is not clickbait for hype. I will take you through my observations in this post to show you why it could play out.

Every market has its stages develop over time: Boom and Bust, Growth and Correction, Collapse and Consolidation. The corrective phase could be around for the stock market.

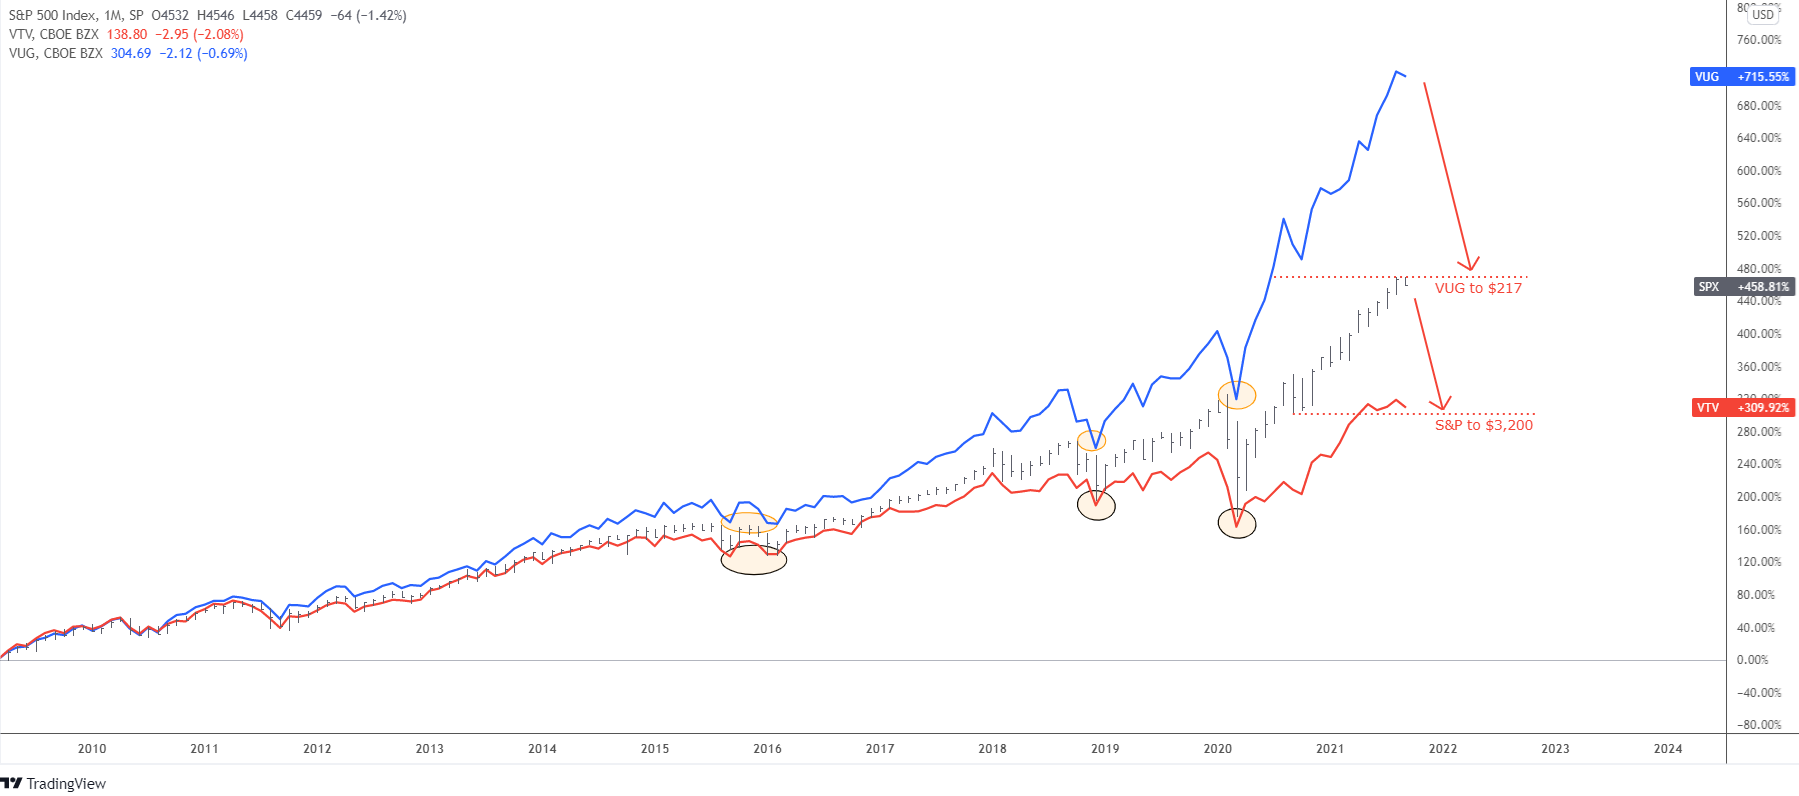
The main question, as always, is how deep it could drop when a retracement unfolds. This is not an easy one. To see the market from different angles, I built the comparison chart as I put the S&P 500 index itself (black bars), then I added Vanguard Value Index Fund ETF (VTV) (red line) and Vanguard Growth Index Fund ETF (VUG) (blue line).

S&P 500

This monthly chart starts from the major bottom in 2009. SINCE THEN, the S&P 500 index has gained more than 450% since then, the value stocks have scored more than 300%, while the growth stocks have made a jaw-dropping 715%. Continue reading "S&P 500 To Lose 30%?"

Weekly Stock Market Forecast

This week we have a stock market forecast for the week of 9/12/21 from our friend Bo Yoder of the Market Forecasting Academy. Be sure to leave a comment and let us know what you think!

The S&P 500 (SPY)

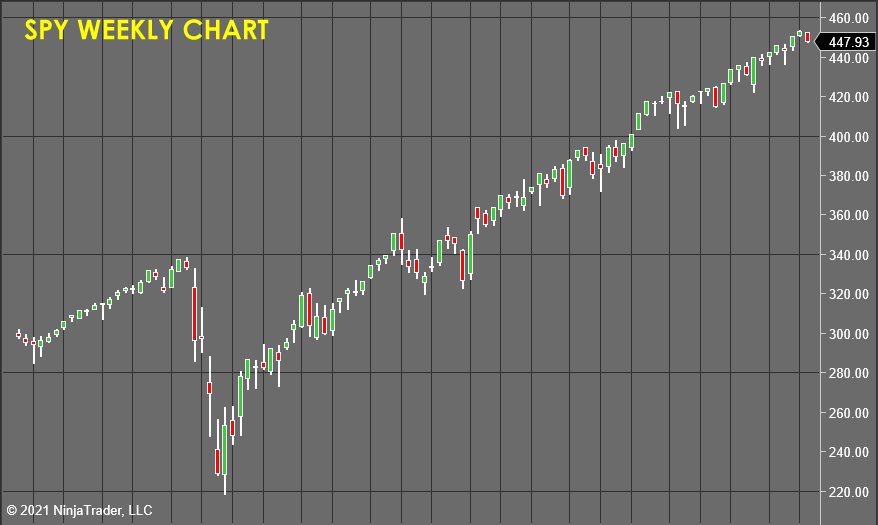
SPY Weekly Chart - Stock Market Forecast

After all our waiting, the S&P finally turned over and printed a bearish, non-hysterical candle on the weekly chart. So next week’s reaction will tell me a lot. If the bears come out in droves, then we can get confident and aggressive on the bear side, but if we sell off early, then close strong, it would indicate that we remain stuck.

I’m building a watch list of short opportunities, but it would be imprudent to enter now, as there just hasn’t been any actionable data coming out of this market for weeks. However, I’m hopeful that will change in the next 7 days. Continue reading "Weekly Stock Market Forecast"

Watch Ethereum As Bitcoin Loses Momentum

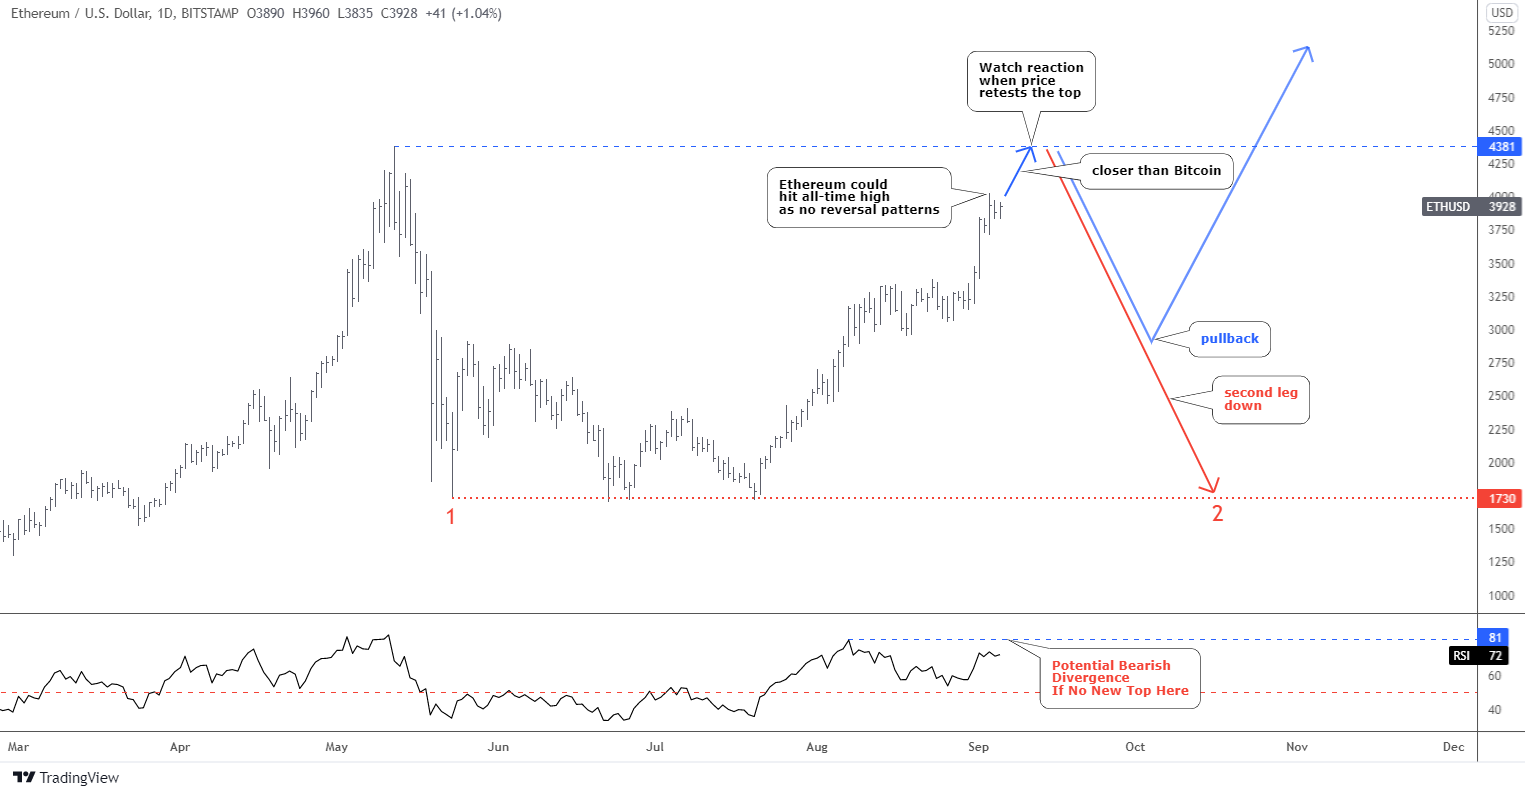
You hit it right when you bet that Ethereum would go higher this July as I called for a complex correction to limit the growth of this cryptocurrency around $3k.

Ethereum

The price hit that upside barrier and stopped there for a while within a visible sideways consolidation. After that, it broke to the upside, as the pause was a harbinger of the uptrend’s continuation. The price quickly hit the $4k handle, and now we could observe a minor consolidation. Continue reading "Watch Ethereum As Bitcoin Loses Momentum"