Silver Hits Charts As Gold Fails To Perform

In my earlier post this month, I shared hot trading opportunities for silver and gold. It’s time for an update as we’ve already seen how it played out.

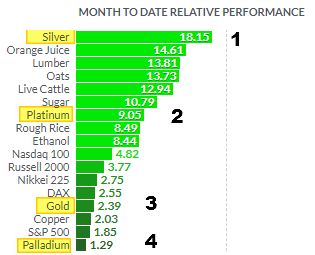
Before we start, I would like to show you the metals performance month-to-date in the graph below.

Futures Board
Chart source: finviz.com

This month silver showed the best performance gaining impressive an +18.15%. The second best wasn’t gold; it’s platinum with a +9.05% gain. Gold is in third place this month, with a +2.39% rise. The most precious of these four metals, palladium, could score only a +1.29% gain.

You were accurate again with your forecast as most of you bet on silver (see chart below) under my last post. Seers in action!

Silver Gold Poll

Let’s get down to the updated charts, and I will start with silver. Continue reading "Silver Hits Charts As Gold Fails To Perform"

Critical Price Level Could Prompt A Big Move

As technical traders and researchers, we’ve been paying very close attention to the GREEN ARC Fibonacci resistance level on the SPY as a key level for the US stock market and any hope of a continued upside price rally. The SPY has traded near this level for the past three weeks and appears to be attempting a bit of an upside breakout right now. Yet, we understand a long holiday weekend is upon us in the US, Memorial Day, and after a big upside GAP on Monday, the US stock market has stalled over the past few days. We've also include charts and analysis for the Russell 2000 and the Transportation index.

Our researchers believe this GREEN ARC is still acting as critical price resistance and believe the SPY may sell off into the end of the week resulting in a failed attempt to breach this key resistance level. If this happens, the failed attempt to break this resistance could prompt a change in price trend and initiate a new downside price trend. If this resistance level is broken by the end of this week, then we have a pretty solid indicator that continued bullish price trending may continue.

Absent of any real news that may drive the market trend this holiday weekend and with most of the US still in shutdown mode, we believe the US stock market has continued to trade within this no man’s land area for many weeks now. From the end of April till now, we’ve seen moderate upside price action in certain sectors, yet other sectors continue to show signs of weakness. Continue reading "Critical Price Level Could Prompt A Big Move"

Gold Eyes All-Time High As Silver Targets Former Top

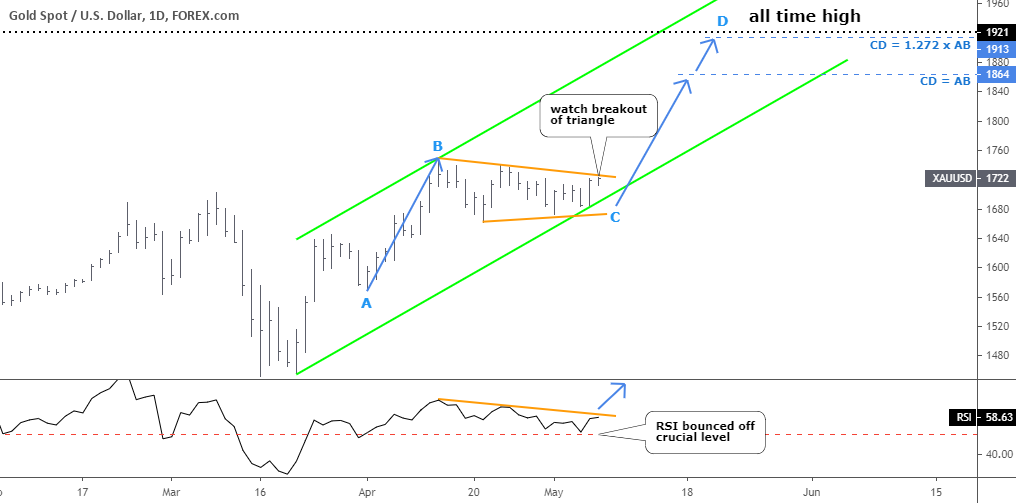
I spotted hot trading opportunities for you on daily charts, so let’s skip straight to it. Gold will be the first.

Gold
Chart courtesy of tradingview.com

Gold got stuck in a sideways consolidation after it hit a new high of $1748 in the middle of April. The lower peaks and higher troughs shaped a very familiar pattern of a contracting triangle (orange trendlines). The price has reached the upper side of that pattern as I write this post. Watch the price to break up out of the triangle to confirm the move up. Continue reading "Gold Eyes All-Time High As Silver Targets Former Top"

Palladium Is At Decision Point: Fly Or Die?

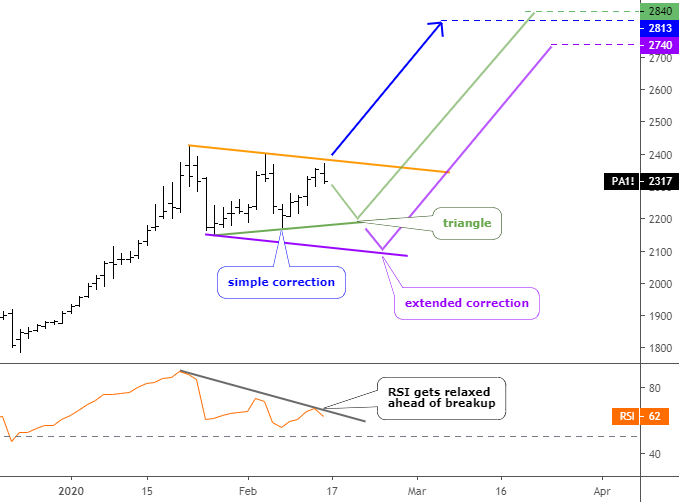
Sometimes forecasts play out right after it you post on the Blog. This was true for the piece published in February when I wondered if “Another All-Time High Ahead For Palladium?”. The target set in the daily chart in the $2800 area was reached within 10 days as the metal burst into uncharted territory to book a hefty profit of 22% or $500.

To remind you, I suggested three possible scenarios of how the palladium price could go in February. The original chart is below to refresh your memory.

Palladium
Chart courtesy of tradingview.com

Below are your votes on the future of palladium. Continue reading "Palladium Is At Decision Point: Fly Or Die?"

Gold Miners And Inflation

I think the case is closed, or it should be closed. But with firmly ingrained perceptions passed down from one generation of inflationist gold bugs to the next, you never know. Remember the old dismissive “gold is silver is copper is tin is oil is hogs” line from the 2003-2008 time frame? Probably not, but I remember it because it was me saying it against an army of inflationist commodity and resources bulls advising to buy gold, buy silver, buy oil… buy resources of all kinds to protect yourself from the evils of inflation!

As an interlude, here is a pleasant interaction I had with a reader (actually, the interaction was his in a comment to an article of mine, but you get the drift) during the 2016 gold sector launch that ultimately proved to be ill-fated by mid-year because… inflation.

I’m sick of internet d******s and the lying media and govt trying to tell me there’s no inflation! Inflation in the US is VERY HIGH. Its currently 8.3%, and has averaged 9.5% over the past 7 years.

Dude, the article was about why gold stocks do not benefit from inflation and why at that time the backdrop was positive (again, it degraded badly later in the year as inflation reared its head). Of course, there is inflation, all along the Continuum of deflationary macro signaling against which they routinely spray the stuff out of fire hoses, like now for example.

Without the secular decline in Treasury bond yields and complete abdication of the mythical Bond market Inflation Vigilantes, the decades-long inflationary regime would not be possible. Jerome Powell was unimaginably hawkish during the market correction of late 2018. The herd could not understand why, but we could. Inflation signals were getting out of hand as the yield spent a couple of months above the Continuum’s limiter (monthly EMA 100).

30 year bond yield

But sure enough, that got fixed as we suspected it would as the Continuum got hammered down since then into today’s deflationary doldrums. The Continuum has reloaded the inflation gun yet again as yields have tanked and bonds have bulled ever since. Continue reading "Gold Miners And Inflation"