Is A Blow-Off Top Setting Up

Our research team has become increasingly concerned that the US Fed support for the markets has pushed price levels well above true valuation levels and that a risk of a downside price move is still rather high. Recently, we published a research article highlighting our Adaptive Dynamic Learning (ADL) predictive modeling system results showing the US stock market was 12% to 15% overvalued based on our ADL results. Today, Tuesday, May 26, the markets opened much higher, which extends that true valuation gap.

We understand that everyone expects the markets to go back to where they were before the COVID-19 virus event happened – and that is likely going to happen over time. Our research team believes the disruption of the global economy over the past 70+ days will result in a very difficult Q2: 2020 and some very big downside numbers. Globally, we believe the disruption to the consumer and services sector has been strong enough to really disrupt forward expectations and earnings capabilities. We’ve been warning our friends and followers to be very cautious of this upside price trend as the Fed is driving prices higher while the foundations of the global economy (consumers, services, goods, and retail) continue to crumble away.

Our biggest concern is a sharp downside rotation related to overvalued markets and sudden news or a new economic event that disrupts forward expectations. Q2 data will likely be a big concern for many, yet we believe something else could act as a catalyst for a reversion event. Possibly global political news? Possibly some type of extended collateral damage related to the global economy? Possibly something related to earnings expectations going forward through the rest of 2020 and beyond? We believe Continue reading "Is A Blow-Off Top Setting Up"

Silver Hits Charts As Gold Fails To Perform

In my earlier post this month, I shared hot trading opportunities for silver and gold. It’s time for an update as we’ve already seen how it played out.

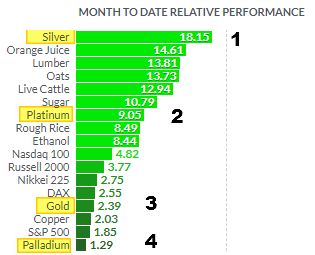
Before we start, I would like to show you the metals performance month-to-date in the graph below.

Futures Board
Chart source: finviz.com

This month silver showed the best performance gaining impressive an +18.15%. The second best wasn’t gold; it’s platinum with a +9.05% gain. Gold is in third place this month, with a +2.39% rise. The most precious of these four metals, palladium, could score only a +1.29% gain.

You were accurate again with your forecast as most of you bet on silver (see chart below) under my last post. Seers in action!

Silver Gold Poll

Let’s get down to the updated charts, and I will start with silver. Continue reading "Silver Hits Charts As Gold Fails To Perform"

Critical Price Level Could Prompt A Big Move

As technical traders and researchers, we’ve been paying very close attention to the GREEN ARC Fibonacci resistance level on the SPY as a key level for the US stock market and any hope of a continued upside price rally. The SPY has traded near this level for the past three weeks and appears to be attempting a bit of an upside breakout right now. Yet, we understand a long holiday weekend is upon us in the US, Memorial Day, and after a big upside GAP on Monday, the US stock market has stalled over the past few days. We've also include charts and analysis for the Russell 2000 and the Transportation index.

Our researchers believe this GREEN ARC is still acting as critical price resistance and believe the SPY may sell off into the end of the week resulting in a failed attempt to breach this key resistance level. If this happens, the failed attempt to break this resistance could prompt a change in price trend and initiate a new downside price trend. If this resistance level is broken by the end of this week, then we have a pretty solid indicator that continued bullish price trending may continue.

Absent of any real news that may drive the market trend this holiday weekend and with most of the US still in shutdown mode, we believe the US stock market has continued to trade within this no man’s land area for many weeks now. From the end of April till now, we’ve seen moderate upside price action in certain sectors, yet other sectors continue to show signs of weakness. Continue reading "Critical Price Level Could Prompt A Big Move"

Gold Eyes All-Time High As Silver Targets Former Top

I spotted hot trading opportunities for you on daily charts, so let’s skip straight to it. Gold will be the first.

Gold
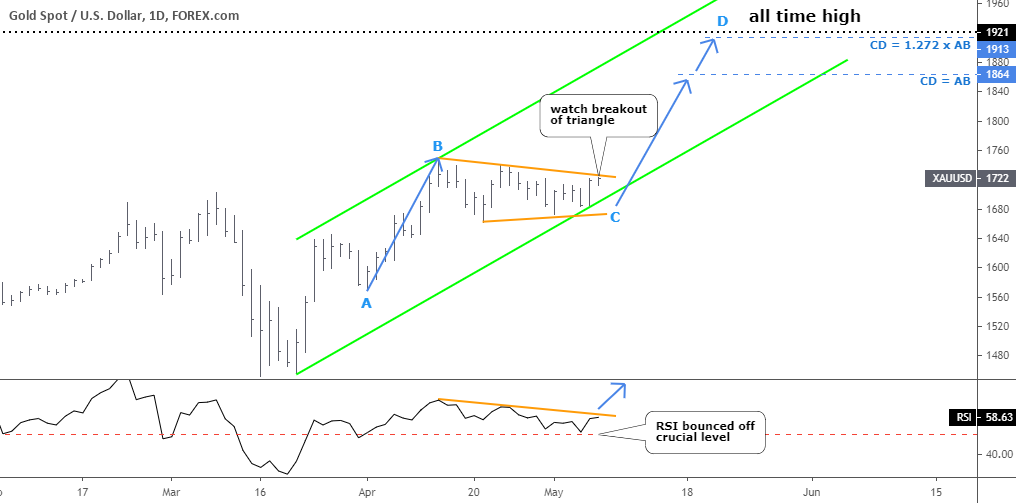
Chart courtesy of tradingview.com

Gold got stuck in a sideways consolidation after it hit a new high of $1748 in the middle of April. The lower peaks and higher troughs shaped a very familiar pattern of a contracting triangle (orange trendlines). The price has reached the upper side of that pattern as I write this post. Watch the price to break up out of the triangle to confirm the move up. Continue reading "Gold Eyes All-Time High As Silver Targets Former Top"

Palladium Is At Decision Point: Fly Or Die?

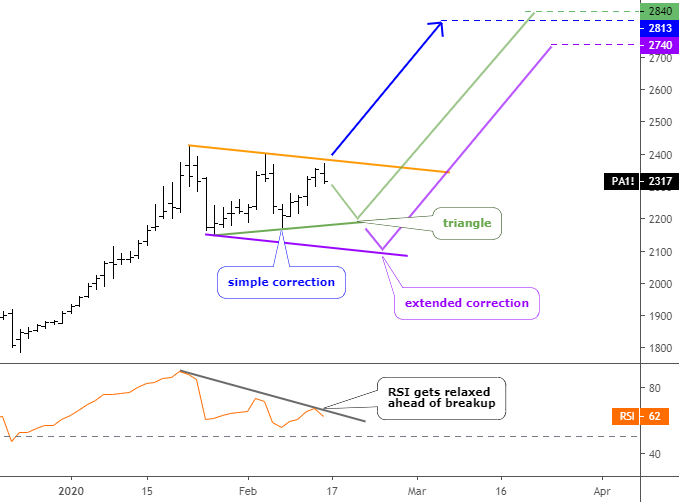
Sometimes forecasts play out right after it you post on the Blog. This was true for the piece published in February when I wondered if “Another All-Time High Ahead For Palladium?”. The target set in the daily chart in the $2800 area was reached within 10 days as the metal burst into uncharted territory to book a hefty profit of 22% or $500.

To remind you, I suggested three possible scenarios of how the palladium price could go in February. The original chart is below to refresh your memory.

Palladium
Chart courtesy of tradingview.com

Below are your votes on the future of palladium. Continue reading "Palladium Is At Decision Point: Fly Or Die?"