Topping Pattern Or Just Consolidation?

The Transportation Index, which typically leads the US stock market by 2 to 4+months, has been unusually aligned with the S&P 500 over the past 8+ months. Recently, though, the Transportation Index has rallied up to recent new all-time highs (over the past 9+ months) and has rotated lower – below resistance near 11,440 (the MAGENTA LINE on the first chart). Our researchers are warning us that any continued breakdown below this level could prompt a bigger downside market move.

Is recent rotation a topping pattern or just consolidation?

Currently, the US stock market has rolled into a sideways/topping pattern. After the peak in metals setup near August 7, 2020, the US stock market continued to rally a bit higher, then rotated lower on September 3, 2020. The Transportation Index rolled over on September 3 but climbed higher less than 5 trading days later – breaking above the highs set before the COVID-19 peak.

We’ve suggested a “Bull Trap” pattern may be forming in the major markets, and we’ve urged traders to be cautious regarding the new price highs and appearance of a continued upside price rally. The Bull Trap pattern, sometimes called a “Scouting Party,” happens when price breaks above resistance (or below support) briefly in an attempt to establish a new trend. If the price fails to find support after breaking above the previous resistance level, it typically rotates lower and collapses back below the resistance level (attempting to find a lower support level).

If our research is correct, the recent rotation in the Transportation Index may suggest a Bull Trap pattern has set up and completed (with the price falling back below the 11,440 level). If this trend continues, we may see a much bigger downside price move where price attempts to find support near 9,800 or 9,200. Continue reading "Topping Pattern Or Just Consolidation?"

Gold & Silver: Too Good To Be True?

The prices of gold and silver remained between triggers last week as volatility left the market, and the “pulse” on the chart is hardly beating. It is time to challenge our bullish view, as it could be “too good to be true.”

Let us imagine if the market is building a more complex correction and another downward move is underway. I put that scenario in the alternative charts for gold and silver below. Before we jump in precious metals, I would like to share with you an updated US dollar index (DXY) 4-hour chart.

dollar

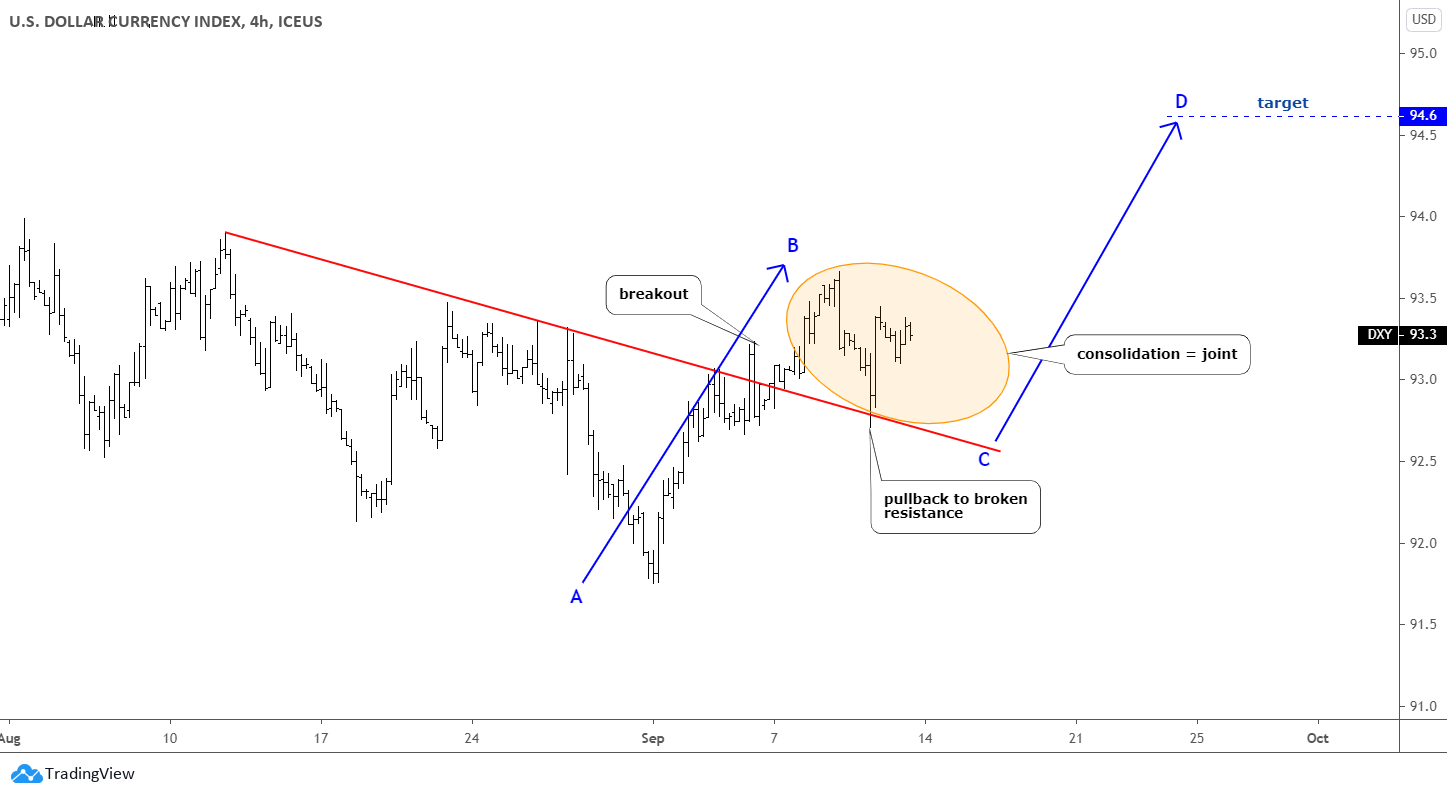
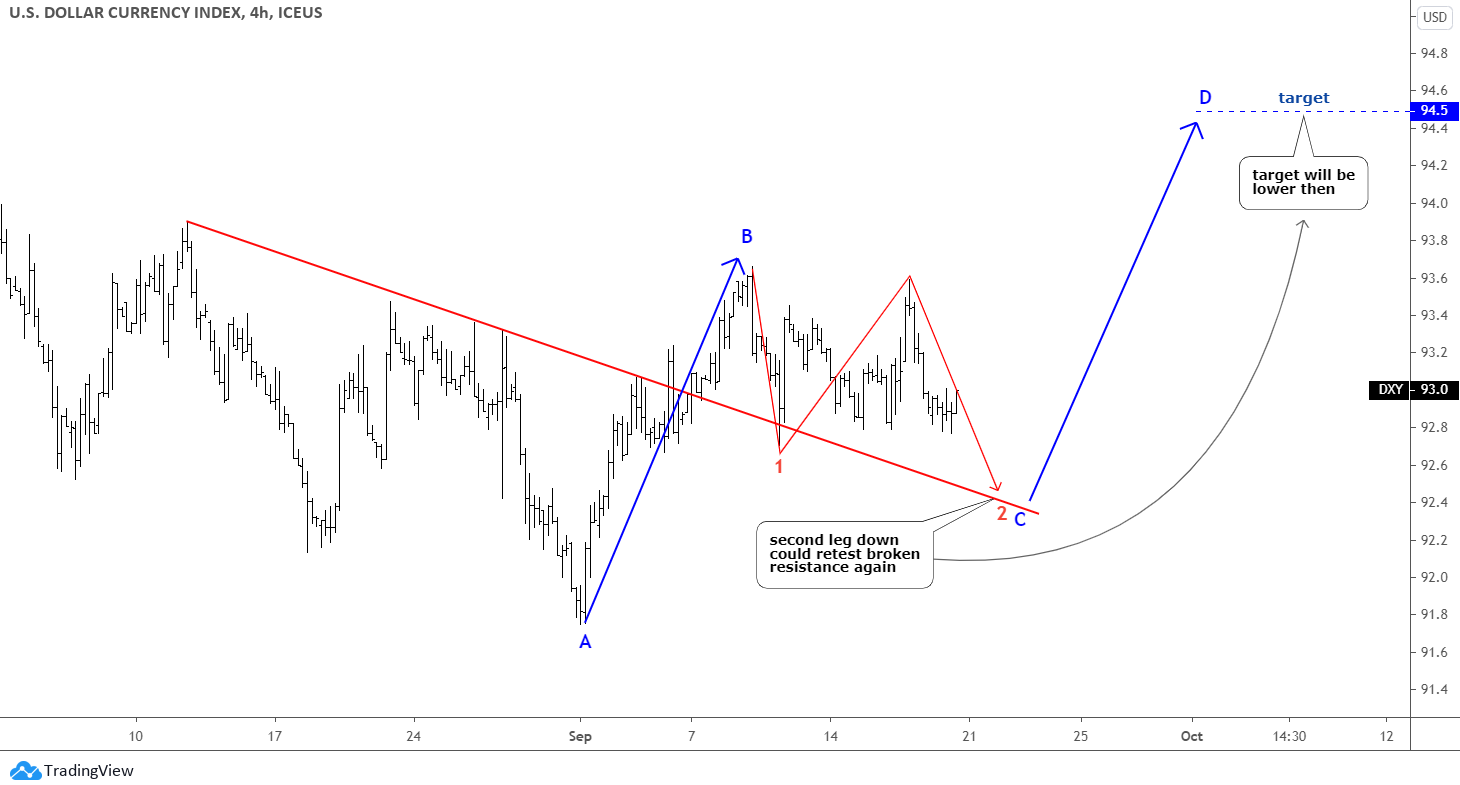
The DXY goes very well with my expectations as the outlined structure keeps intact, and we got a larger consolidation here with a second leg down underway. It could dip even lower to retest the former resistance again in 92.4 area. That will cut the target for the pending CD segment either to 94.5 from the earlier aim of 94.6. Continue reading "Gold & Silver: Too Good To Be True?"

What's Next For The Dollar, Gold And Silver?

We have an interesting situation in the market as the strength of inversely correlated instrument didn’t push the other asset price down. Such things happen, and I showed you in the past that the correlation itself is not a dogma. The market flows are driven by investors’ sentiment, which in turn is based on subjective judging.

Let’s see the updated charts below, and the US dollar index (DXY) will be the first.

Dollar

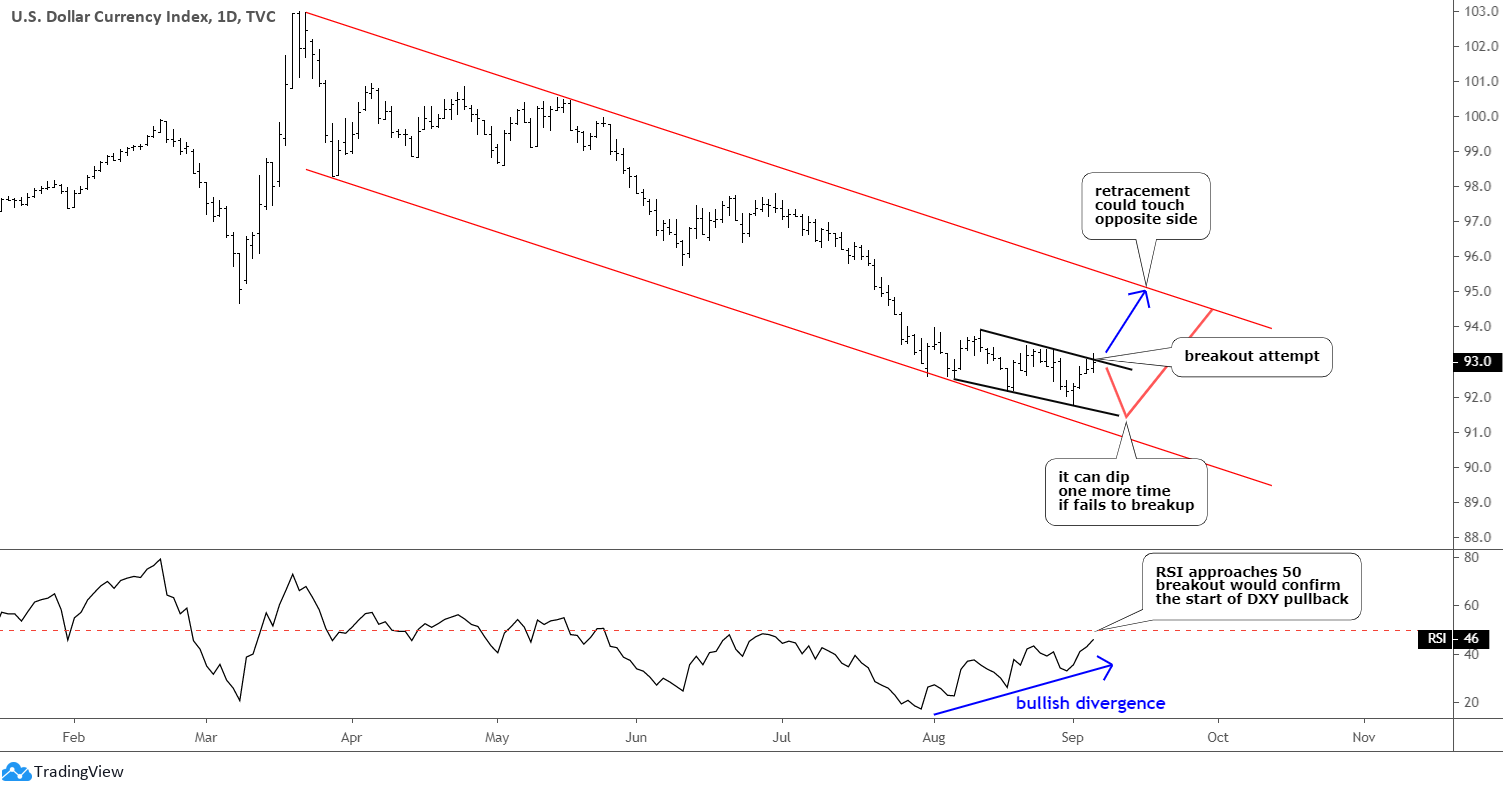
The votes under my previous post about the next move for DXY were split evenly between “break up” and “another drop” options. It’s quite a natural outcome as we never know for sure if a breakout would happen or not. The extreme bullish divergence on the daily RSI finally enforced the price to break up the red resistance. Continue reading "What's Next For The Dollar, Gold And Silver?"

Dollar Index, Gold And Silver Updates

The summer sure has flown by. It was full of events, and we got a new all-time high gold price then. The fall should be an interesting season, as well as “The Volcano Awoke” for precious metals and more “eruptions” are expected ahead.

I updated the charts for you below, and the US dollar index (DXY) daily chart will open this post.

Precious Metals

The majority of readers voted earlier that the dollar index will reach the upside of the red trend channel. The second most popular choice that DXY will not exceed the former top of 94 and continue down (Extremely Bearish) paid well as price indeed couldn’t overcome that barrier and dropped again. Then there was another attempt, and another drop as the chart structure has shown seesaw moves within a black channel. It affected the precious metals price as they have been trapped in the sideways zigzags as well. Continue reading "Dollar Index, Gold And Silver Updates"

Dollar Index, Gold And Silver Updates

The market moves in zigzags and not in a straight line as it takes a break from time to time to accumulate enough power to continue with the trend. In my post last week, I mentioned the US dollar index (DXY) as one of the drivers of the precious metals rally. This time I would like to share the daily chart of it below as I spotted a reversal signal there, which could affect precious metals.

Dollar Index

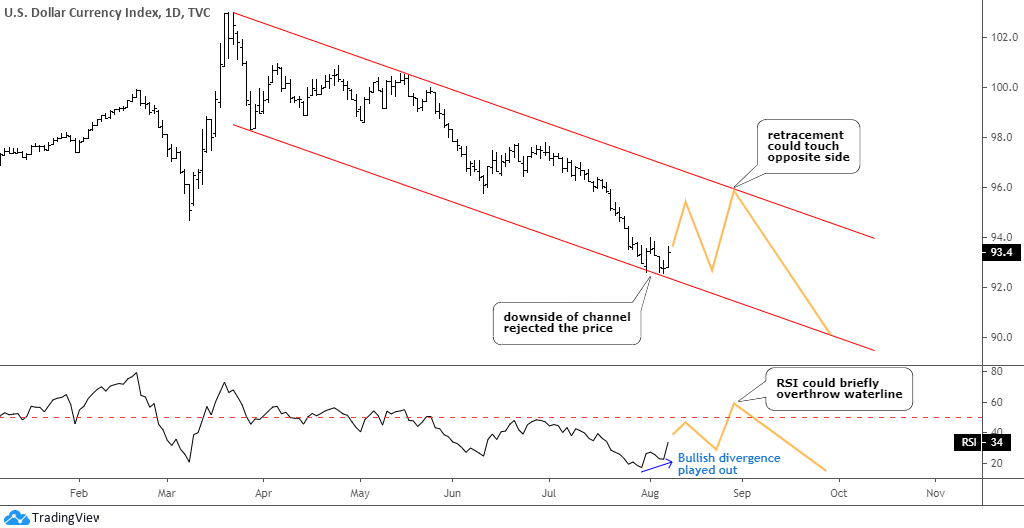
The DXY price was rejected right at the contact point with the downside of the red downtrend channel. The price tried that support twice on the 31st of July and the 6th of August but failed to break below. This, again and again, demonstrates the power of simple trend channels.

The other move was very sharp to the downside within two equal zigzags pushing the price from 100.9 to 92.5. The DXY was oversold, and now it could enter the retracement stage to let traders book some profit covering shorts, and contrarian traders might enter longs here playing on the trendline rejection. The price could touch the opposite side of the trend channel around 96 as this could be not a minor, but a large corrective structure as we saw such last time only this April. Continue reading "Dollar Index, Gold And Silver Updates"